Chart Settings
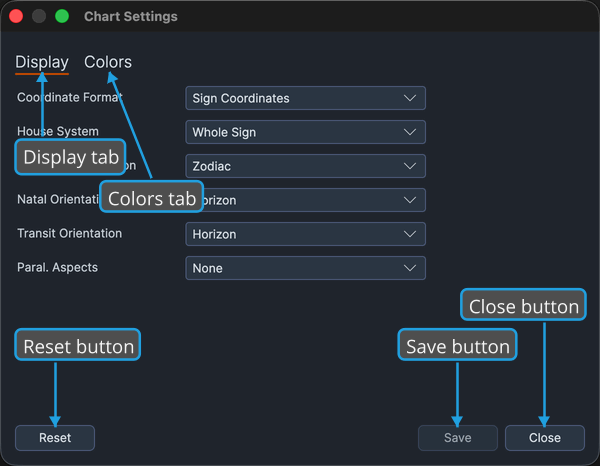
The Chart Settings window holds the application-wide chart appearance and display defaults that every new chart opens with. It is organized into two tabs, Display and Colors, with a bottom bar for resetting, saving, and closing your changes.
Chart Settings is a single global window shared by all chart types. If it is already open, opening it again brings the existing window back to the front.
In this section
- Chart Display Defaults: the Display tab, where you set the coordinate format, house system, per-type orientations, and parallel-aspect display that new charts open with.
- Chart Colors: the Colors tab, where you set the wheel colors of the zodiac signs, planets, and other bodies.
Opening Chart Settings
- Click Edit → Chart Settings on the main menu bar.
You can also open Chart Settings from the main toolbar or from the toolbar of any open chart window.
Saving, resetting, and closing
The bottom bar of the window carries Reset, Save, and Close.
Save your changes
Saving writes the current settings to disk, and they become the defaults new charts open with.
- Click the Save button.
Reset to the built-in defaults
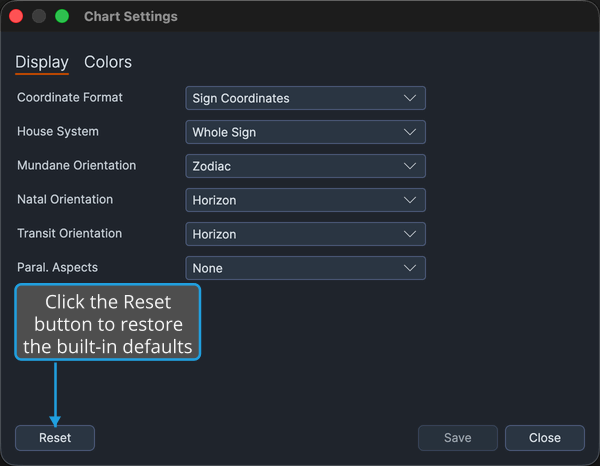
Resetting replaces every chart setting, both colors and display defaults, with the built-in defaults. The change previews live but is not written to disk until you save.
To reset all chart settings to the built-in defaults:
- Click the Reset button.
- Confirm at the Confirmation Dialog to replace every color and display default with the built-in values.
Close the window
- Click the Close button.
If the window has unsaved edits, an Unsaved Changes prompt appears first. From that prompt you can Save Changes at the Unsaved-Changes Prompt, Discard Changes at the Unsaved-Changes Prompt, or Cancel Closing at the Unsaved-Changes Prompt.