Graph Hover Readout
Read the exact value and date of a point on a curve without estimating them from the axes. Move the pointer over a curve on the ephemeris graph and read the readout box beside the marker.
Show a Curve's Readout
You can show the readout on any Graphic Ephemeris or Graphic Aspect Ephemeris study that has been generated and whose graph shows curves.
To read a point on a curve:
- Rest the pointer on a curve of the graph.
A crosshair appears, with a marker on the nearest sample of the curve and a readout box beside the marker. The pointer needs only to be over or near the curve. The readout disappears when the pointer leaves the plot or when you begin a drag.
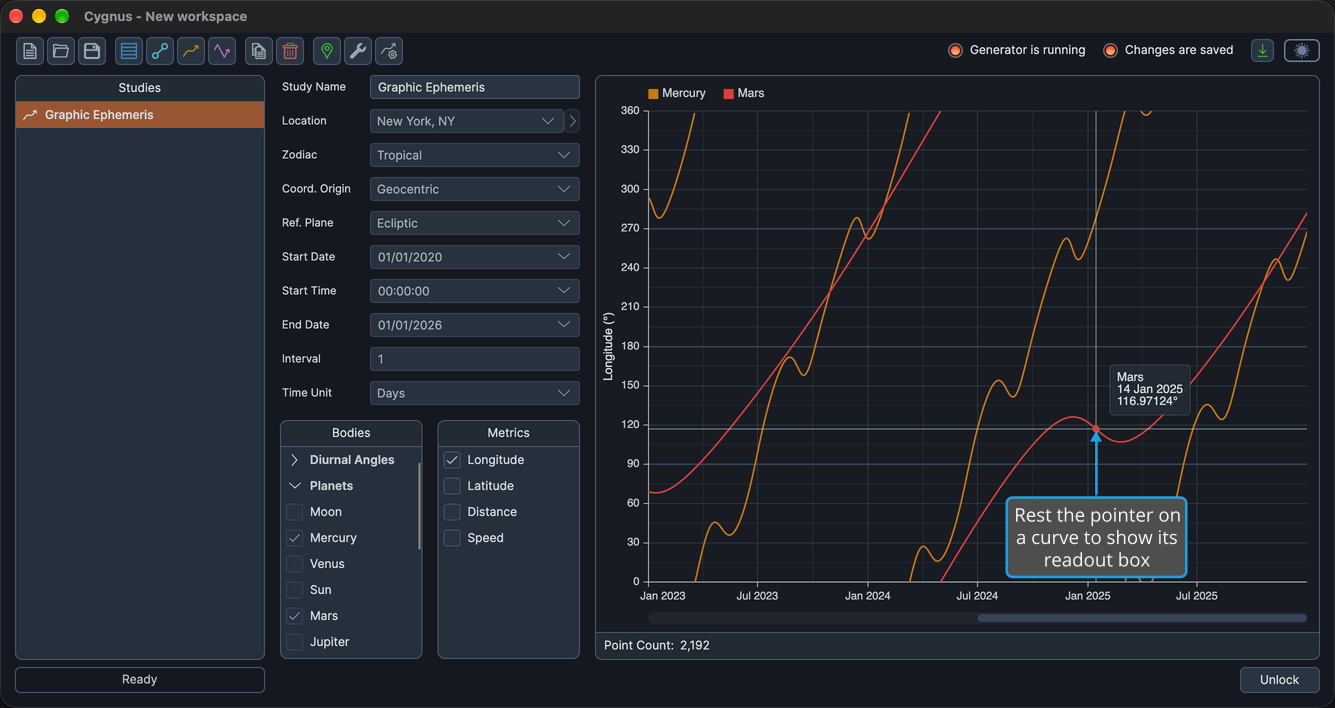
What the Readout Shows
The readout box gives three pieces of information:
- The name of the curve.
- The sample's date, with the time when the time axis shows times.
- The sample's value, in the unit of the value axis that scales it.
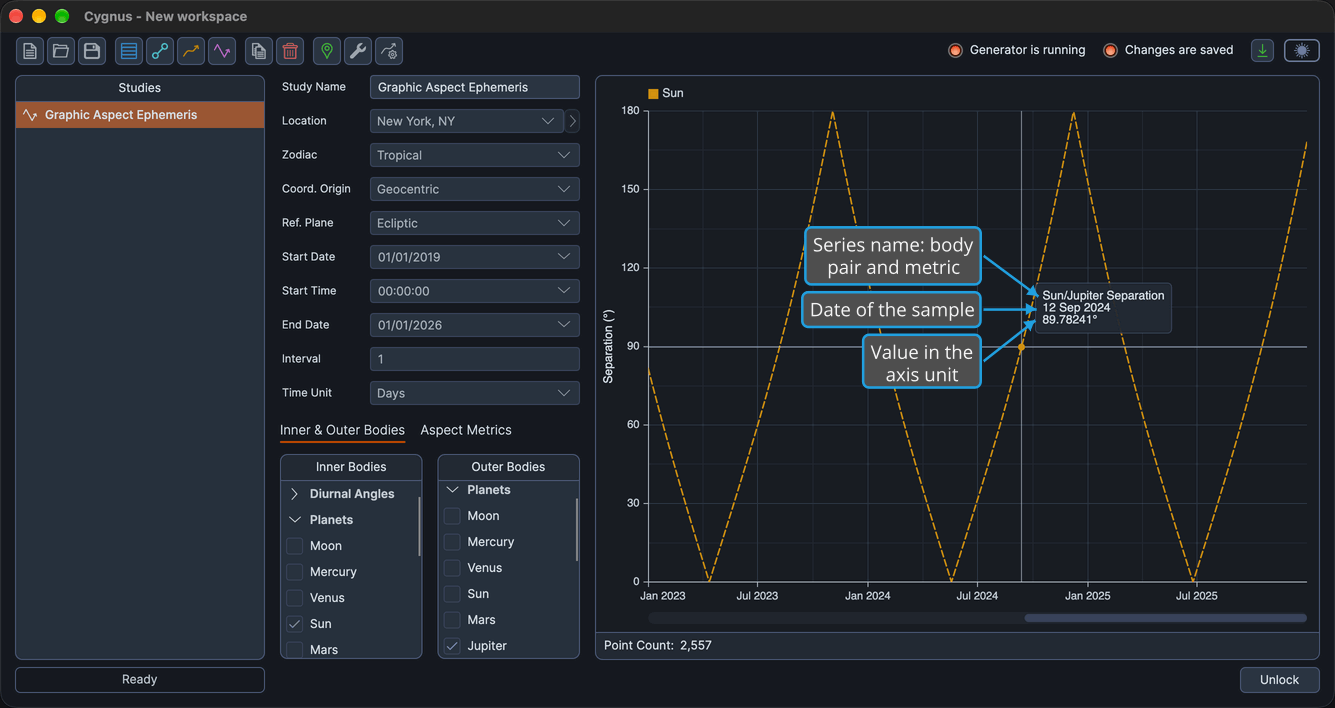
How the curve is named depends on the study type:
| Study Type | Curve Name in the Readout |
|---|---|
| Graphic Ephemeris | The body, but not the metric. The line's color and pattern identify the metric, as described in Ephemeris Graph. |
| Graphic Aspect Ephemeris | The body pair and the metric, for example "Sun/Jupiter Separation". |
On a Graphic Ephemeris study, distances are in AU and speeds in degrees per day.
Related Topics
- Ephemeris Graph: the parts of the graph and how its curves are drawn.
- Pan and Zoom the Graph Time Window: bring the period you want to read into view.
- Open a Graph Point's Chart in Compass: open the chart for a point on a curve.