Pan and Zoom the Graph Time Window
Look closely at one period of a long graph, or step back to see the whole span. The time window is the stretch of time the ephemeris graph shows. Drag inside the plot to move through time, drag the time-axis strip left or right or roll the mouse wheel to zoom, use the scroll bar to scroll, and double-click the time-axis strip to reset.
These gestures work on the graph of any Graphic Ephemeris or Graphic Aspect Ephemeris study that has been generated and whose graph shows plotted curves. Each gesture acts on one region of the graph:
| Region | Where It Is | Gestures |
|---|---|---|
| Plot | The area where the curves are drawn | Drag to pan; roll the mouse wheel to zoom |
| Time-axis strip | The strip at the foot of the plot | Drag to zoom; roll the mouse wheel to zoom; double-click to reset |
| Scroll bar | Beneath the time axis | Drag the thumb or roll the mouse wheel to scroll; click the track to page |
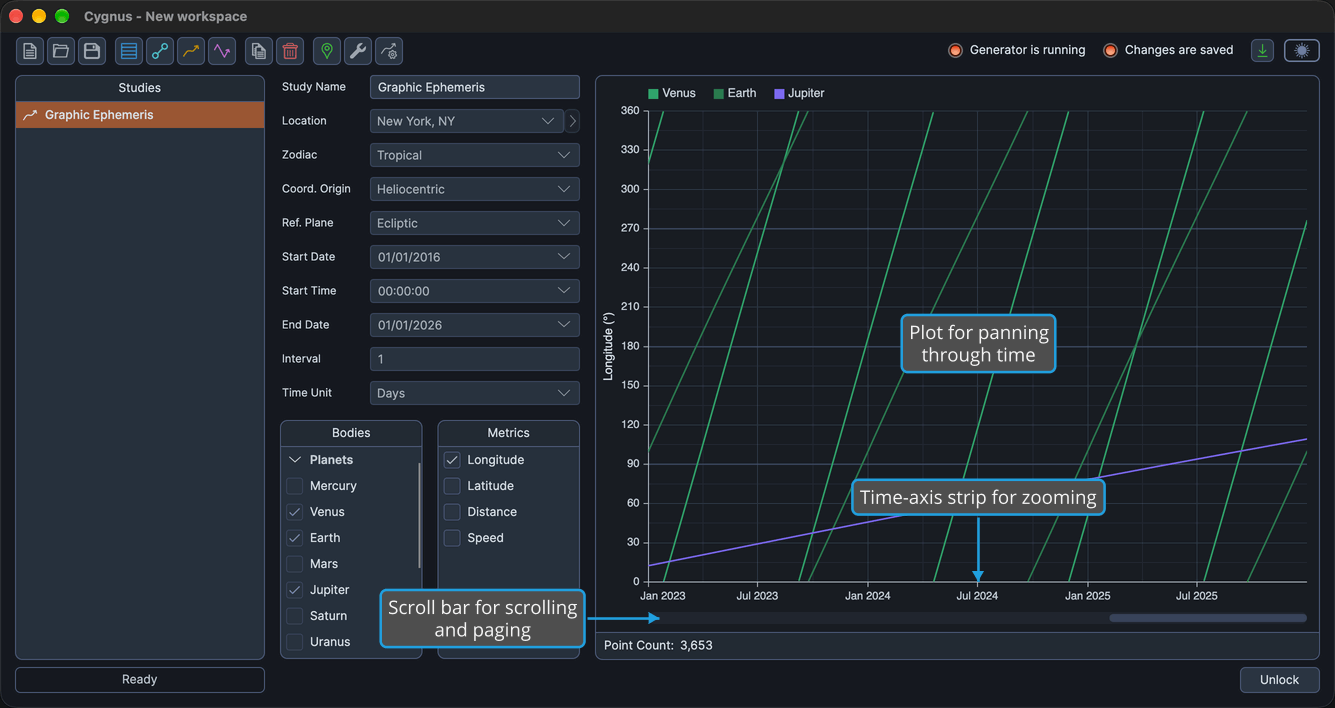
The time window is not saved with the study. Each time you open the study, the graph shows the latest part of the generated span again.
Pan Through Time
To move the time window earlier or later without changing its length:
- Drag horizontally inside the plot: right to bring earlier dates into view, or left to bring later ones.
The curves follow the pointer. The window keeps its length and stops at the ends of the generated data. The hover readout is hidden while you drag.
Start the drag inside the plot. A drag that starts on a value axis adjusts that axis's range instead, as described in Adjust a Graph Value Axis Range, and a drag that starts on the time-axis strip zooms.
Zoom In or Out
To show a shorter or longer stretch of time:
- Drag horizontally on the time-axis strip at the foot of the plot: left to zoom in, or right to zoom out.
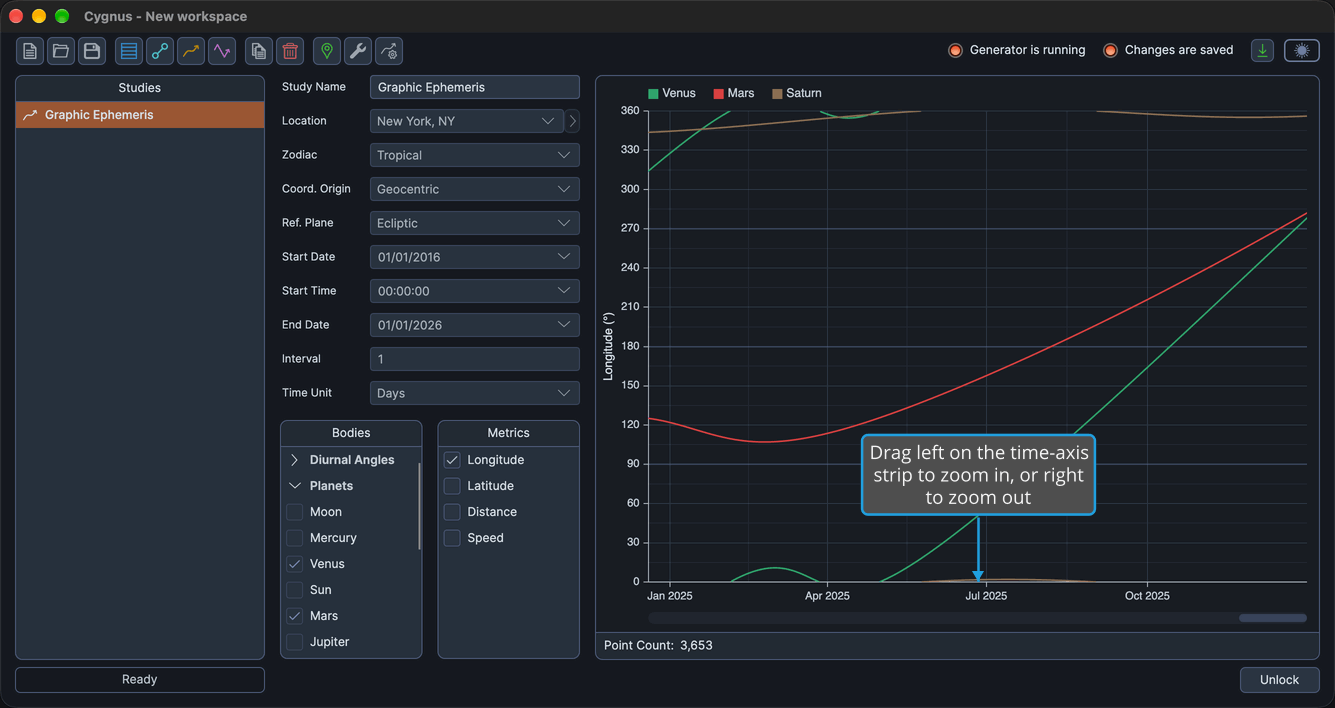
The zoom is anchored at the right edge of the window, and the window stays between ten samples and the whole generated span.
You can also zoom by rolling the mouse wheel over the plot or over the time-axis strip. The wheel zooms around the instant under the pointer instead of the right edge.
Scroll the Time Window
The scroll bar has a thumb only when the time window shows less than the whole generated span.
To scroll the time window along the generated span:
- Drag the scroll bar's thumb horizontally.
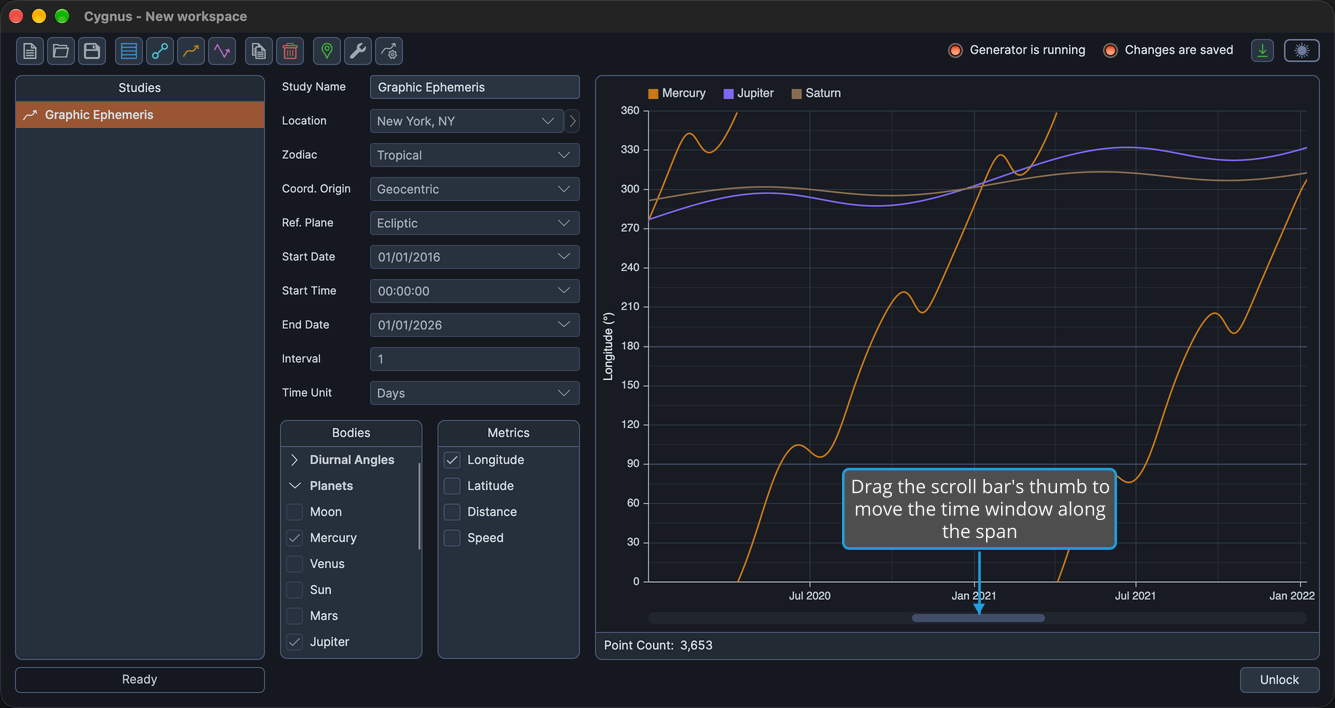
The window moves earlier or later as you drag, keeping its length. Rolling the mouse wheel over the scroll bar also scrolls the window, instead of zooming it.
Page the Time Window
Like scrolling, paging needs a scroll bar with a thumb.
To step the time window one page at a time:
- Click the scroll bar track beside the thumb, on the side you want to page toward.
The window moves one page toward the click. Hold the mouse button down to repeat the page steps while the thumb has room to move toward the pointer. A double-click on the track pages twice; it does not reset the window.
Reset the Time Window
To return the graph to its default time window:
- Double-click the time-axis strip at the foot of the plot.
The default time window, the latest part of the generated span, is restored. Adjusted value-axis ranges are kept.
Where you double-click matters. A double-click on a value axis restores that axis's range instead, as described in Adjust a Graph Value Axis Range. A double-click on a curve opens the chart for that point in Compass, as described in Open a Graph Point's Chart in Compass.
Related Topics
- Ephemeris Graph: the parts of the graph and how its curves are drawn.
- Graph Hover Readout: read the exact date and value of a point on a curve.
- Adjust a Graph Value Axis Range: widen or narrow the range of one metric's axis.