Adjust a Graph Value Axis Range
Magnify small variations in a metric, or fit a wide-ranging metric, without changing the time window. Each plotted metric on the ephemeris graph has its own value axis beside the plot. Point at a value axis and drag down to widen its range or up to narrow it, and double-click the axis to restore the default.
You can adjust the value axes of any Graphic Ephemeris or Graphic Aspect Ephemeris study that has been generated and whose graph is showing.
Adjust a Value Axis Range
When the pointer is over a value axis, it changes to a vertical resize pointer.
To stretch or compress the scale of one metric:
- Drag vertically on a value axis beside the plot: down to widen its range, or up to narrow it.
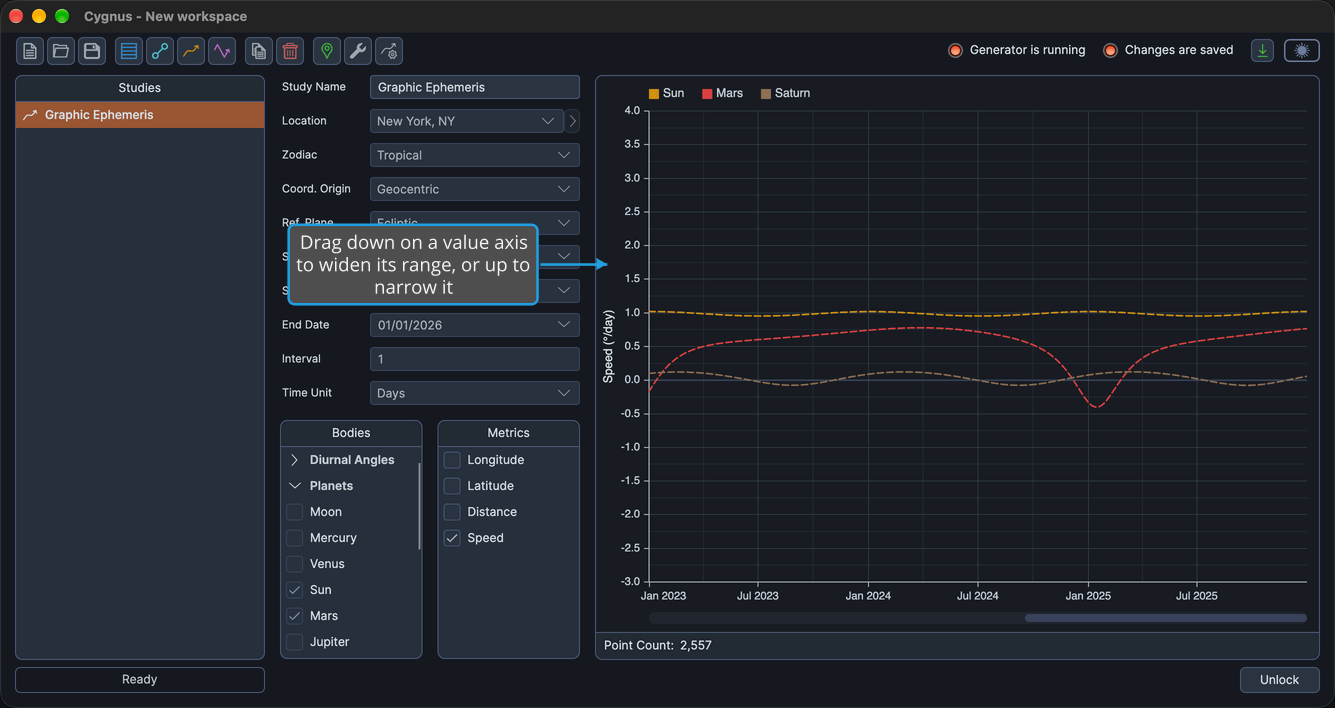
The range widens or narrows symmetrically about the center of the axis, in rounded steps, and the curves the axis scales are redrawn. The time window stays as it is.
Restore a Value Axis Range
To return an adjusted value axis to its default range:
- Double-click the value axis.
The axis returns to its default range and the curves it scales are redrawn. The time window and the other axes are unchanged.
Saved Ranges
Adjusted ranges are saved with the study, and they are kept when you unlock the study, as described in Unlock Study.
Two changes to the study's settings reset adjusted ranges:
- Changing the study's reference plane resets the value axes that depend on the reference plane.
- On a Graphic Ephemeris study, switching the coordinate origin to or from Heliocentric resets the Latitude, Speed and Distance axes.
Both settings are described in Location and Reference System.
Related Topics
- Ephemeris Graph: the parts of the graph and how its curves are drawn.
- Pan and Zoom the Graph Time Window: change the stretch of time the graph shows.
- Graph Hover Readout: read the exact date and value of a point on a curve.