Zoom the Graph Time Window
Zooming changes how much time the plot shows at once, so you can move between an overview of the whole generated span and a close look at a few days. The gesture lives on the time axis strip at the foot of the plot, the band carrying the axis line and its date labels, where the pointer changes to a horizontal resize cursor.
Zoom the Visible Time Window
To change the width of the visible period:
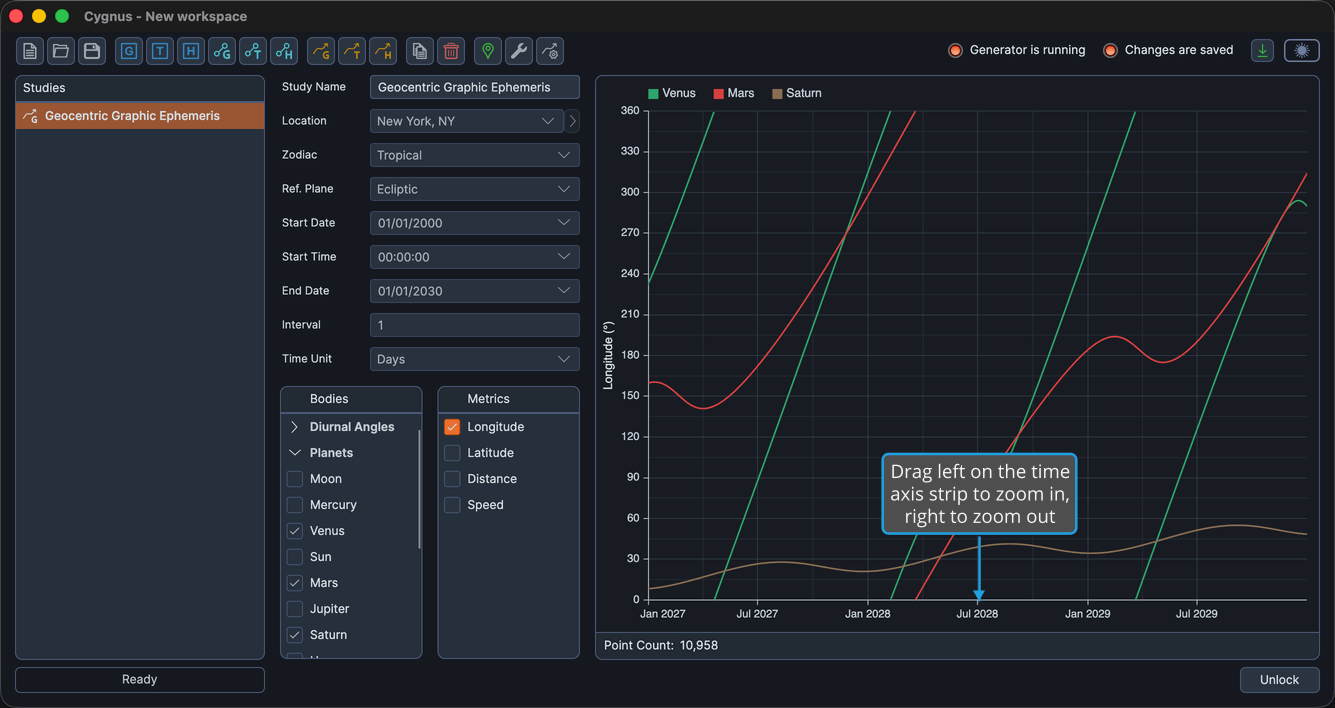
- Press and hold on the time axis strip and drag left to zoom in or right to zoom out.
The window is anchored at its right edge, so zooming out pulls more of the past into view rather than shifting the period you were looking at. The zoom is limited to between ten samples and the full generated span.
Restore the Default Time Window
To get back to the view the plot opened with:
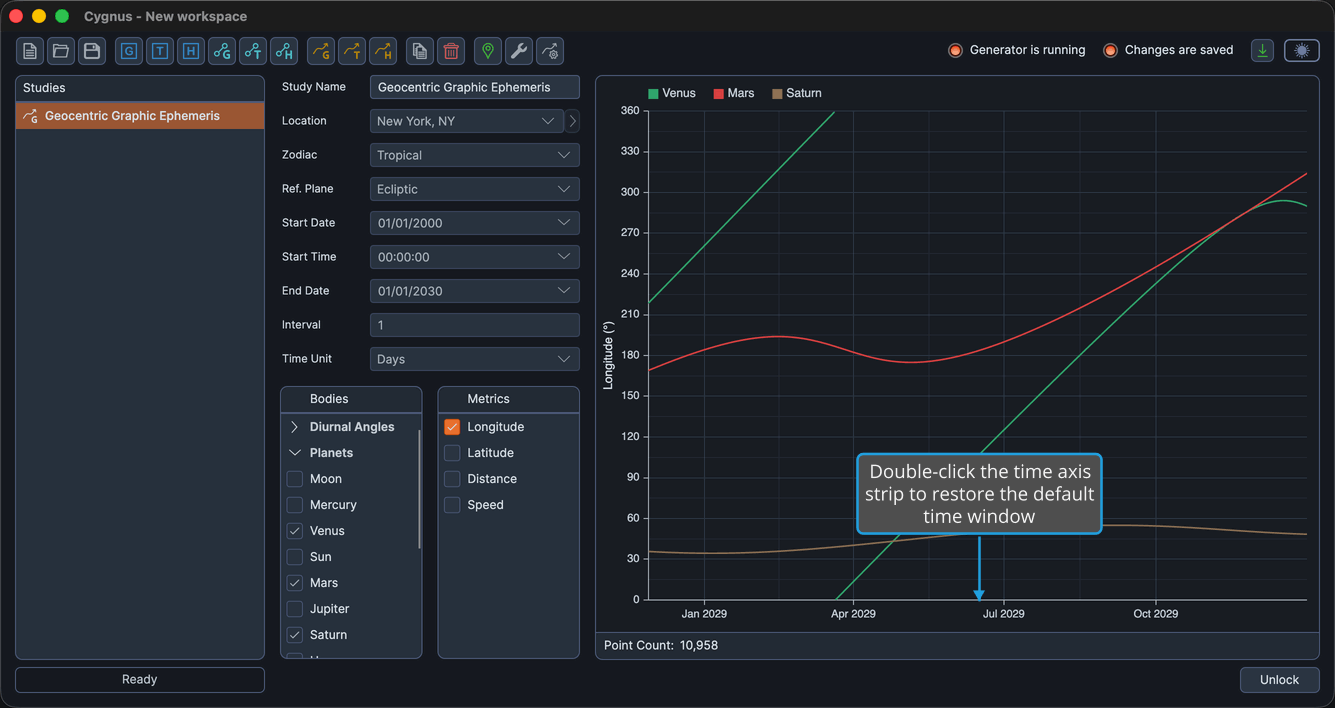
- Double-click the time axis strip.
The time window returns to the default view of the most recent part of the generated span. Any value-axis ranges you have set are left in place.