Speed Extrema Study
A body at its fastest or its slowest marks a turning point in the way it moves through the zodiac, one that its stations do not account for. The Speed Extrema study dates those turning points for the bodies you follow.
The study generates an event each time a selected body reaches a maximum or a minimum of longitudinal speed. Each event carries the body's position and speed at that moment.
Create a Speed Extrema Study
To add a Speed Extrema study to the current workspace:
- Click Mundane Studies → Longitudinal Studies on the menu bar.
- Click Speed Extrema in the Longitudinal Studies submenu.
Alternatively, click the Arc Studies drop-down button on the toolbar and select Speed Extrema from its flyout.
The new study appears at the bottom of the Studies list and is selected automatically, so its settings open immediately. It takes its name from the study type.
What This Study Finds
A speed extremum is the moment a body stops accelerating and begins to slow, or stops slowing and begins to speed up again. Speeds are given in degrees per day, and the study records the instant of every such turning point across the date range for each body you check.
Its settings carry an Event Type drop-down, which restricts the study to maxima or to minima, and a single Bodies selection list.
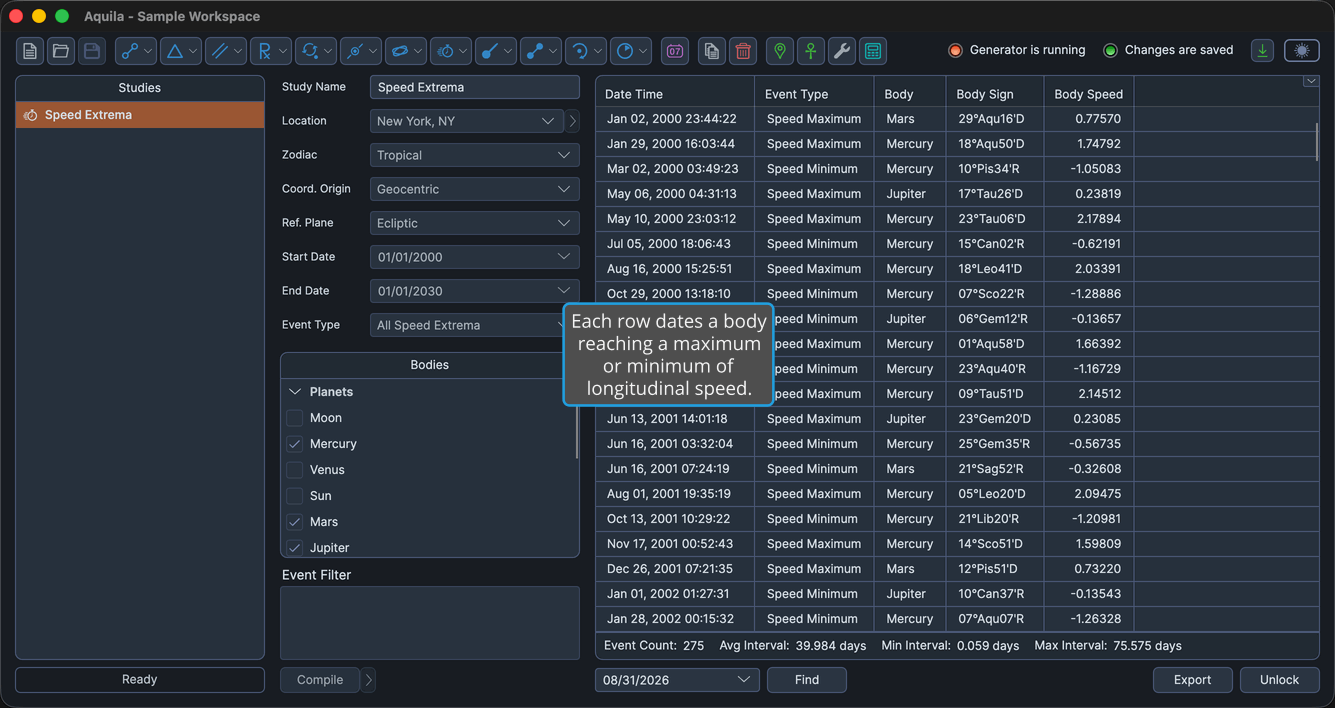
Events Table Columns
The events table lists one row per extremum. Several columns are hidden by default, as the table notes. Right-click any column header to show or hide a column, as described in Choose Events Table Columns. The header text of the coordinate columns follows the study's Reference Plane: they read Longitude and Latitude in the ecliptic plane and Right Asc and Declination in the equatorial plane. The table below uses the ecliptic-plane headers.
| Column | Description |
|---|---|
| Date Time | Date and time the event perfects, in the application's long date-time format. Always the first column, and it cannot be moved. Visible by default. |
| Event Type | Which kind of turning point the event records, a speed maximum or a speed minimum. Visible by default. |
| Body | Name of the celestial body. Visible by default. |
| Body Longitude | The body's primary coordinate in degrees. Hidden by default. |
| Body Sign | The body's position as degrees, sign and minutes of the zodiac. Visible by default. |
| Body Latitude | The body's secondary coordinate in degrees. Hidden by default. |
| Body Distance | The body's radial distance in astronomical units (AU). Hidden by default. |
| Body Speed | The body's speed in degrees per day. Visible by default. |
| Event Interval | Elapsed time since the previous event in the list. Hidden by default. |