Choose Events Table Columns
Event types carry many metrics, and only a few of them matter for a given question. Hiding the rest makes the table readable on screen, without having to export it and cut columns elsewhere.
Right-clicking any column header in the events table opens a menu listing every available column for that study's event type, with a checkbox beside each. Checking an entry immediately shows that column and unchecking it immediately hides it. The menu stays open so you can change several columns in one visit.
Many of a study's columns are hidden when it opens. If a metric you expect is missing from the table, look for it in this menu rather than assuming the study does not record it.
Show a Column
To bring a hidden metric column back into the events table:
- Right-click any column header in the events table.
- Check the checkbox beside the column's name in the menu.
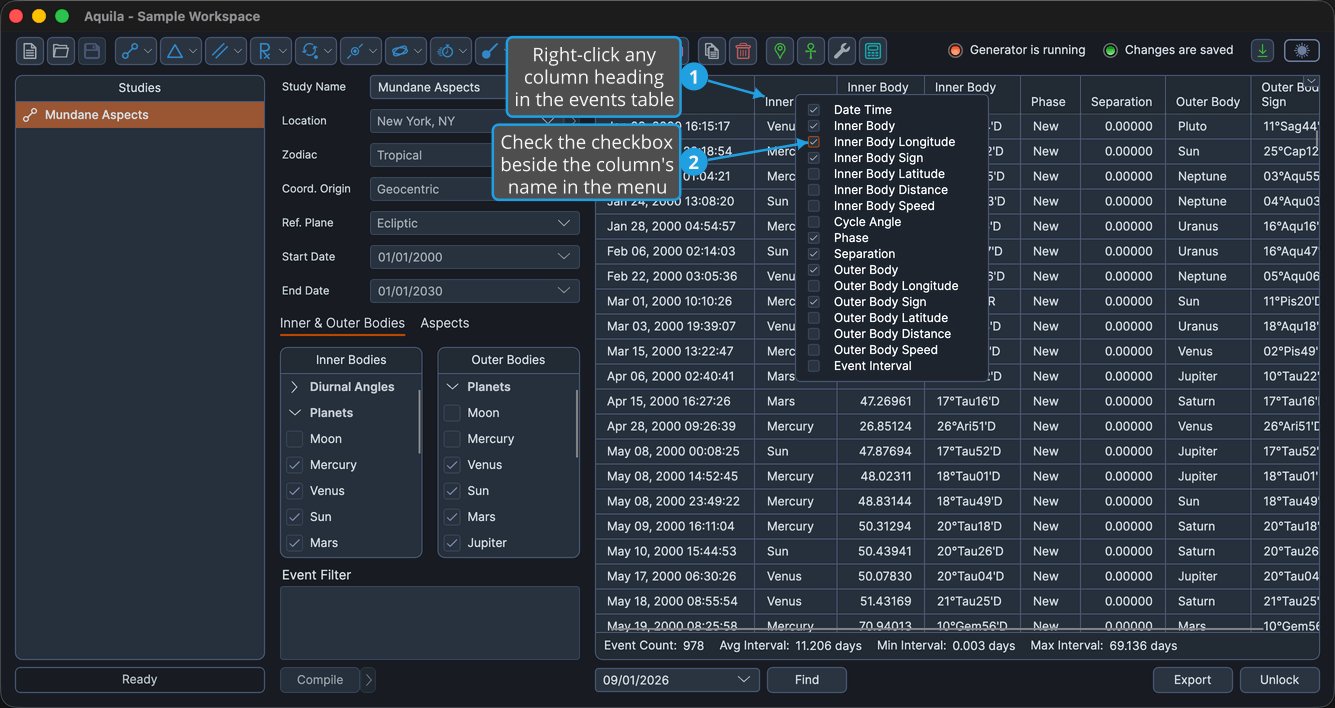
The column appears in the table immediately, and the menu stays open so you can change further columns in the same visit.
Hide a Column
To take a column the current question does not need out of the events table:
- Right-click any column header in the events table.
- Uncheck the checkbox beside the column's name in the menu.
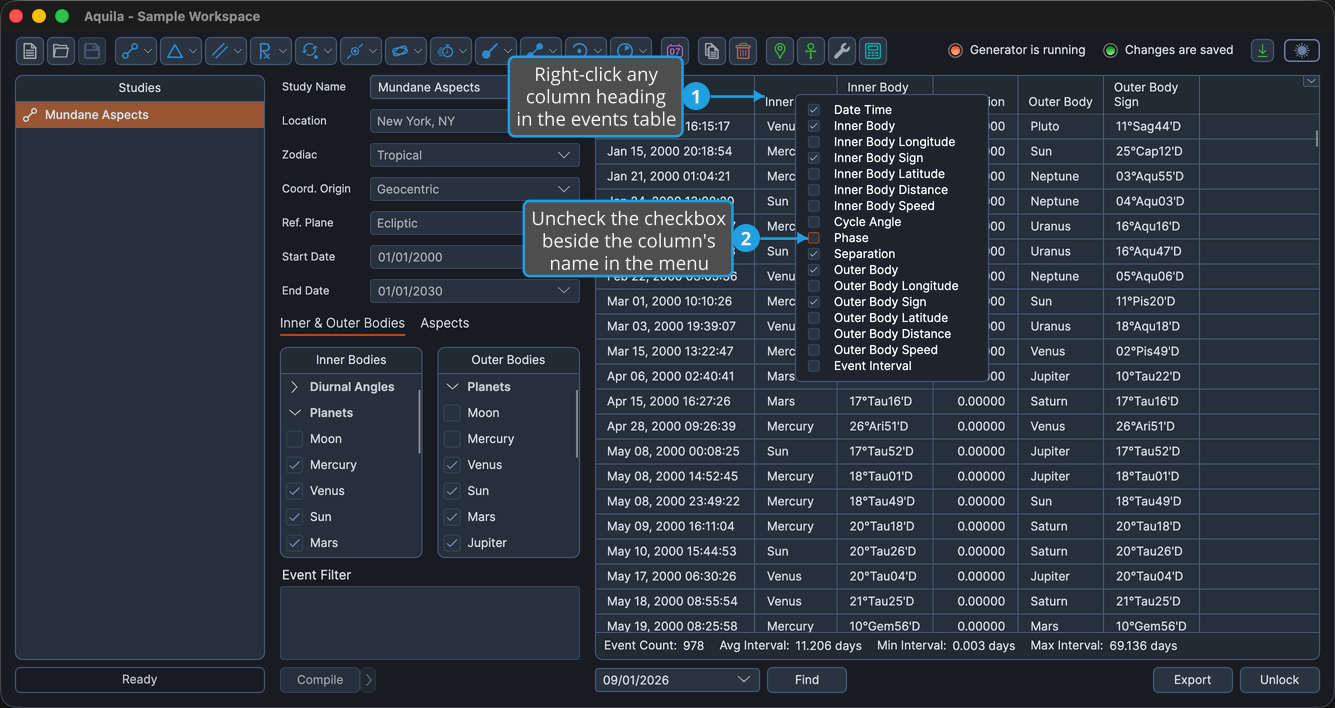
The column disappears from the table immediately, and the menu stays open.
What the Menu Lists
The menu is a live view of the table's own columns, so its entries follow the table: they are listed in the order the columns currently sit in, and a table you have rearranged produces a rearranged menu.
Which entries appear depends on the study type, because each event type records its own set of metrics:
| Menu Entry | When It Appears |
|---|---|
| Date Time | On every study, at the head of the menu. |
| Event Type | On studies whose events carry a subtype. |
| One entry per metric | On every study, one for each metric the study's event type records. |
The entry text is the column header you read in the table, so it follows the study's Reference Plane setting: a column listed as Longitude in the ecliptic plane is listed as Right Asc in the equatorial plane, and Latitude as Declination. For the full list of columns a particular study offers, see that study's own page, each of which carries a table of its events table columns.