Event Statistics
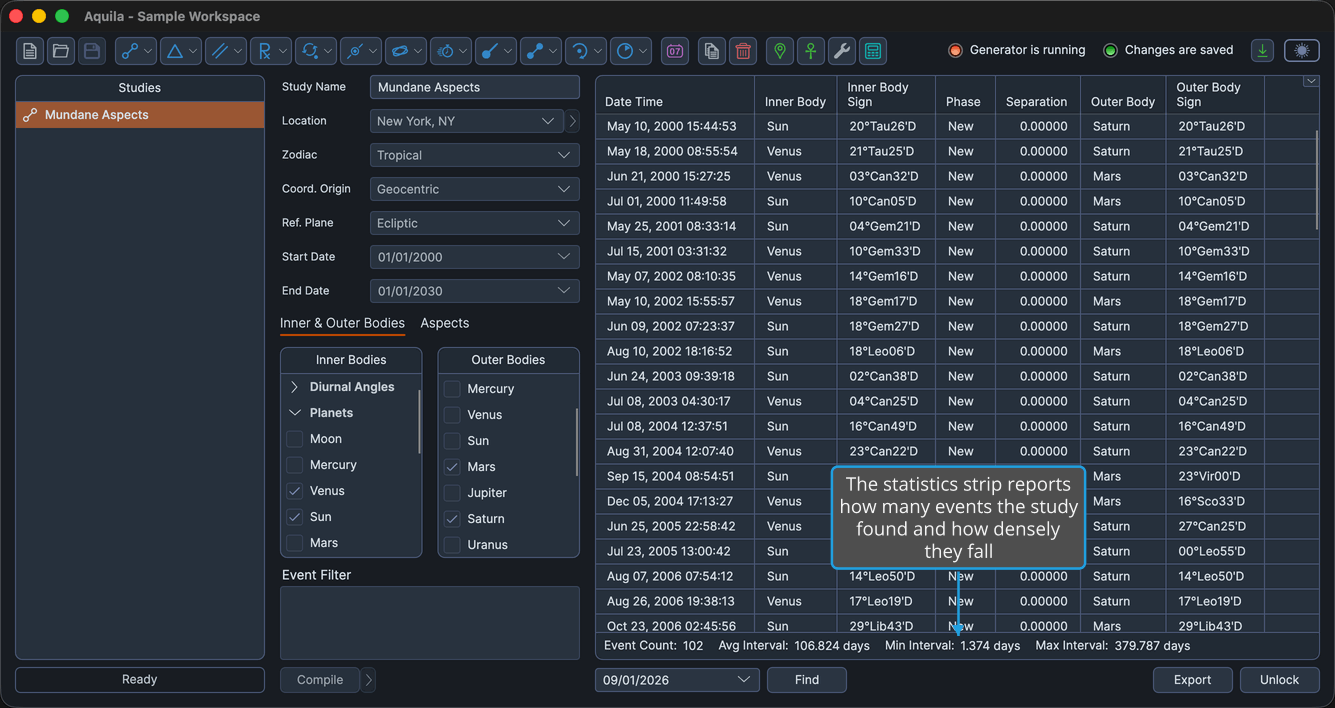
Before reading individual events, it helps to know how many the study found and how densely they fall. The statistics strip gives that sense at a glance, and it is a quick check that the configuration was neither too narrow nor too broad.
The strip sits immediately beneath the events table and appears once the study's events have been generated.
Read the Statistics
The strip carries no controls of its own, so there is nothing to switch on. Generate the study's events and the readouts are there. See Generate Events.
What the Strip Reports
| Readout | What It Reports |
|---|---|
| Event Count | How many events the study generated across its date range. |
| Avg Interval | The mean number of days between consecutive events. |
| Min Interval | The shortest gap in days between two consecutive events. |
| Max Interval | The longest gap in days between two consecutive events. |
Read together, the count and the intervals say whether the configuration was pitched about right: far more events than expected, or far fewer, is the first sign that the date range, the bodies or the orb need adjusting. To change them, unlock the study and generate its events again. See Unlock Study.