Events Table
The events are a study's output, so reading them, scanning them for pattern and picking individual moments out of them is the research itself.
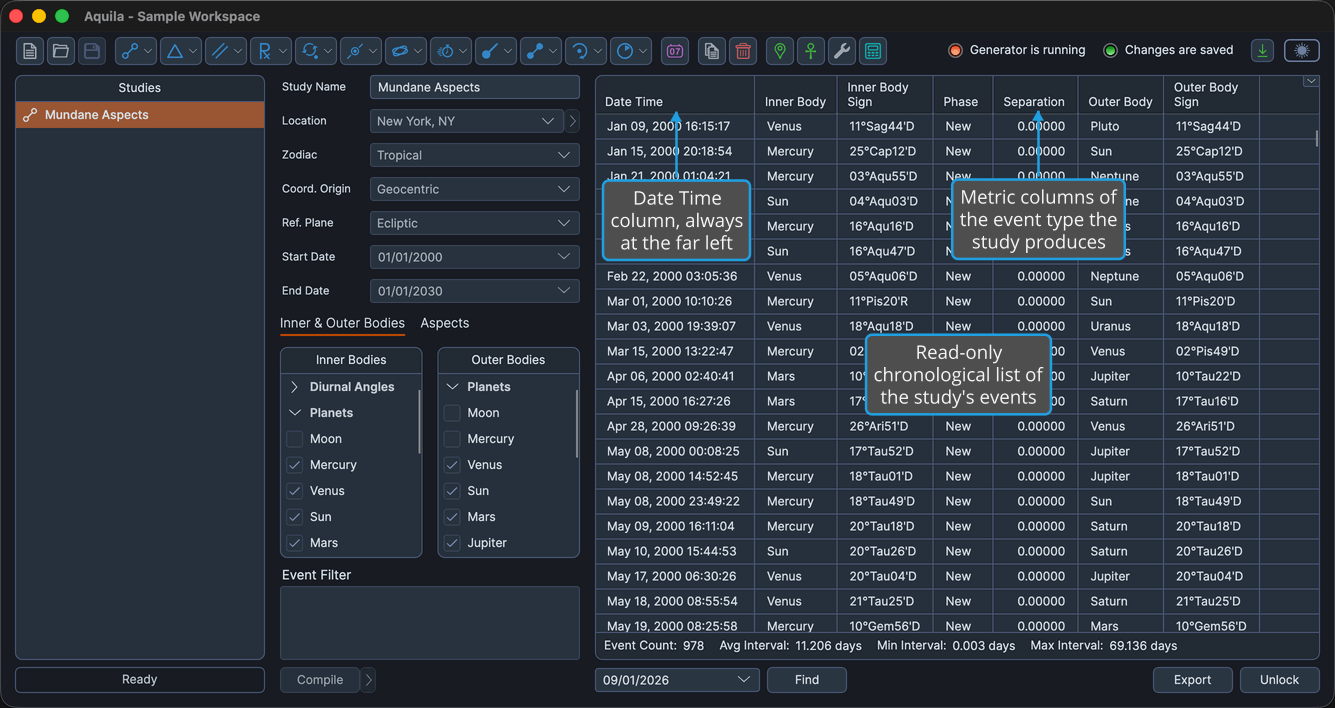
The events table fills the right-hand side of every generator study view. It lists the events the study generated, one per row, in chronological order. The table is read-only, and it scrolls smoothly even when a study has generated many thousands of rows.
Read the Table
Every table opens with a Date Time column at the far left, giving the date and time the event perfects. Studies whose events carry a subtype add an Event Type column beside it. The columns after those two are the metrics of the event type the study produces, so a Mundane Aspects study and a Lunar Eclipses study show different columns.
The table cannot be sorted. Clicking a column header does not reorder the rows, which are always listed chronologically. What a column header offers instead is the right-click menu that shows and hides columns. See Choose Events Table Columns.
Select Events
To pick a single event out of the results:
- Click the event's row in the events table.
Aquila highlights the clicked row, which becomes the study's selected event.
To highlight a contiguous block of events so you can act on several rows at once:
- Click the first event's row in the events table.
- Hold Shift and click the last event's row in the events table.
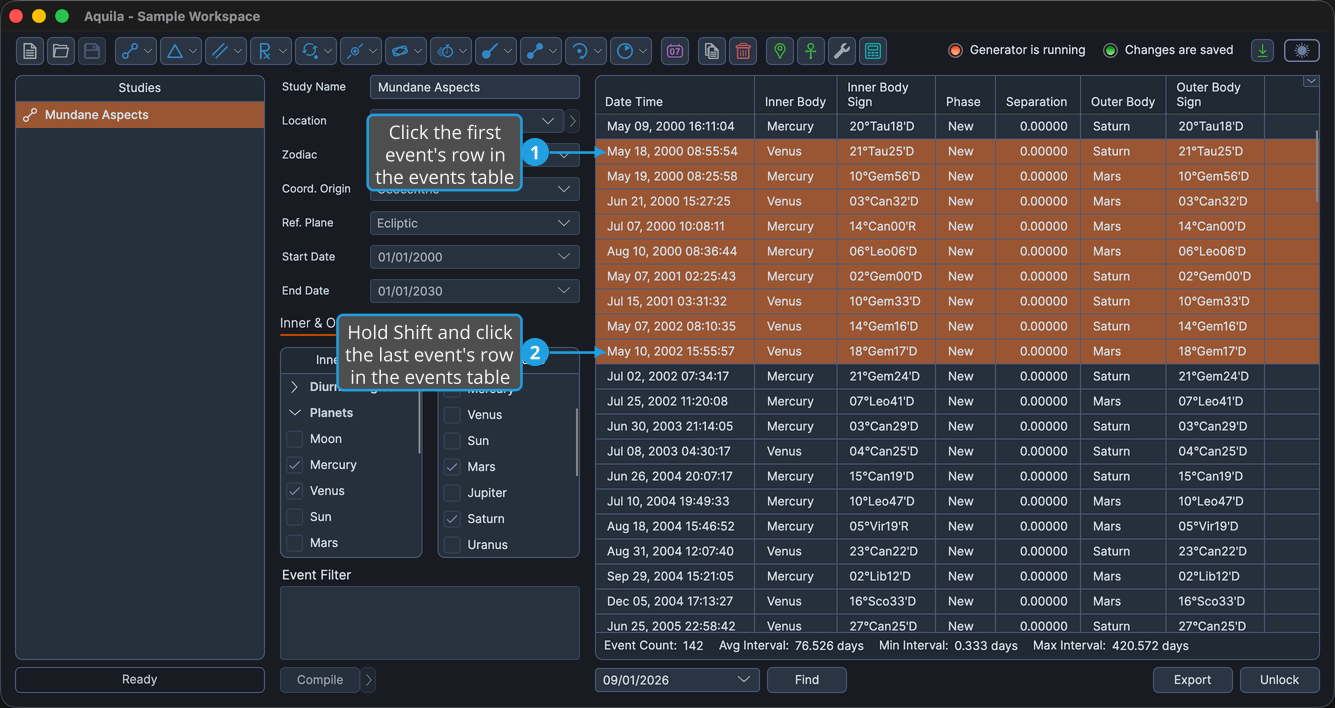
Aquila highlights every row between the first and last click, and the commands that act on a multi-row selection become available. See Copy Events.
Table Columns
The column set is fixed for any given study. It is built from the metrics that study's event type records, never from your data or from the results, so the same study type always offers the same columns. For the exact columns a study shows, see that study's own page, each of which carries a table of its events table columns.
Many of the available columns are hidden when a study opens, so the table starts with the metrics most often wanted and keeps the rest a right-click away. See Choose Events Table Columns.
One setting changes what the column headers say. The Reference Plane on the study's ephemeris settings swaps the header text of the coordinate columns: a column headed Longitude in the ecliptic plane is headed Right Asc in the equatorial plane, and Latitude becomes Declination. Only the wording changes. The column keeps its position in the table and reports the same measurement either way.
The same handful of metric families recurs across every study type:
| Column Kind | What It Reports |
|---|---|
| Body | Name of the celestial body. |
| Longitude, or Right Asc in the equatorial plane | Primary coordinate in degrees. |
| Sign | Position as degrees, sign and minutes of the zodiac. |
| Latitude, or Declination in the equatorial plane | Secondary coordinate in degrees. |
| Distance | Radial distance in astronomical units (AU). |
| Speed | Speed in degrees per day. |
| Separation, Cycle Angle and other angular metrics | Angular value in degrees. |
| Event Interval | Elapsed time since the previous event in the list. |
A study whose events involve more than one body carries a set of these columns for each of them, prefixed with the part that body plays in the event, Inner Body Speed and Outer Body Sign for instance.
Work with the Results
The events table is the starting point for everything else you do with a study's results:
- Land on a period of interest without scrolling: Find Nearest Event
- Put selected rows on the clipboard: Copy Events
- Write the result set out as a file: Export Events
- See the sky at an event's moment: Open Chart from an Event