Event Statistics
The statistics bar is a summary strip beneath the events table. It appears once a study finishes generating events and gives you a quick quantitative overview of the results without scrolling through the table.
The bar reports the following values:
| Statistic | Description |
|---|---|
| Event Count | The total number of events the study generated. |
| Average Interval | The average number of days between consecutive events. |
| Minimum Interval | The shortest interval, in days, between two consecutive events. |
| Maximum Interval | The longest interval, in days, between two consecutive events. |
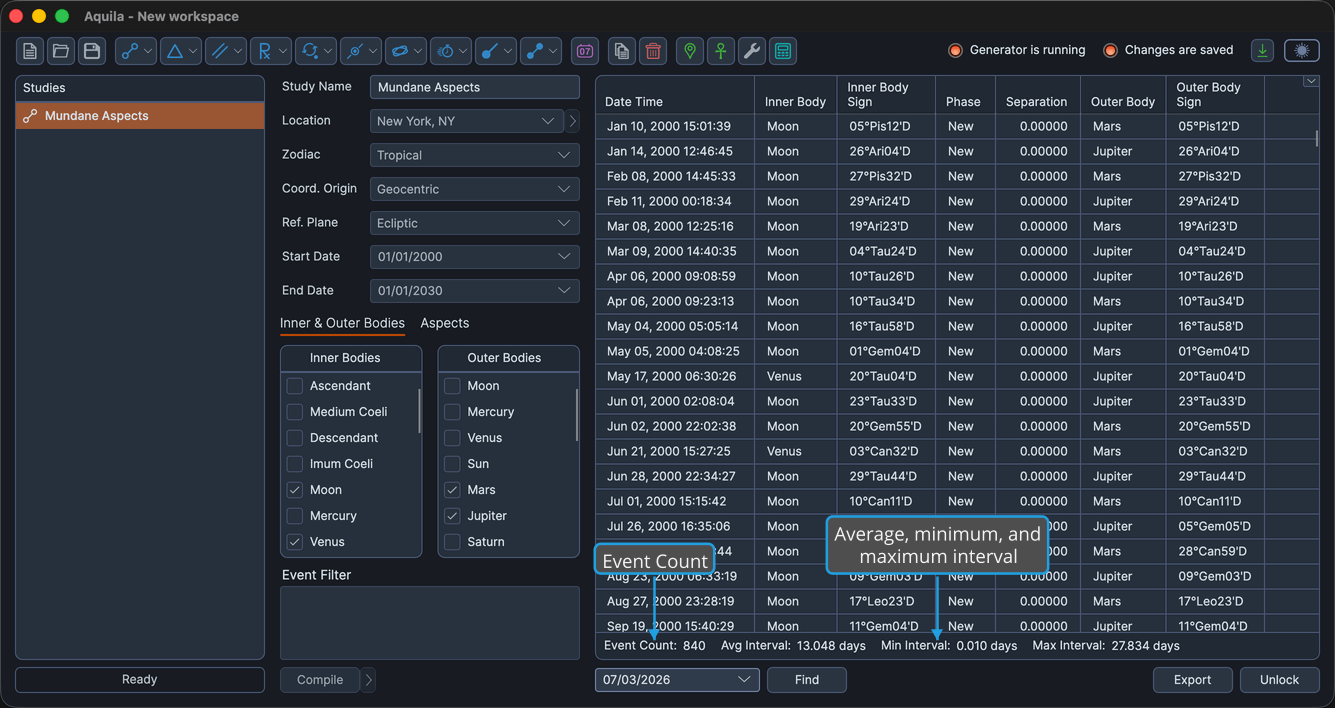
The interval statistics summarize how the study's events are spaced across your date range, which is useful for gauging how frequent or rare a pattern is.