Open Chart from an Event
A row in the events table says when something happened. Seeing the sky at that moment is the natural next question, and it should not mean copying the date out and typing the study's settings into another application by hand.
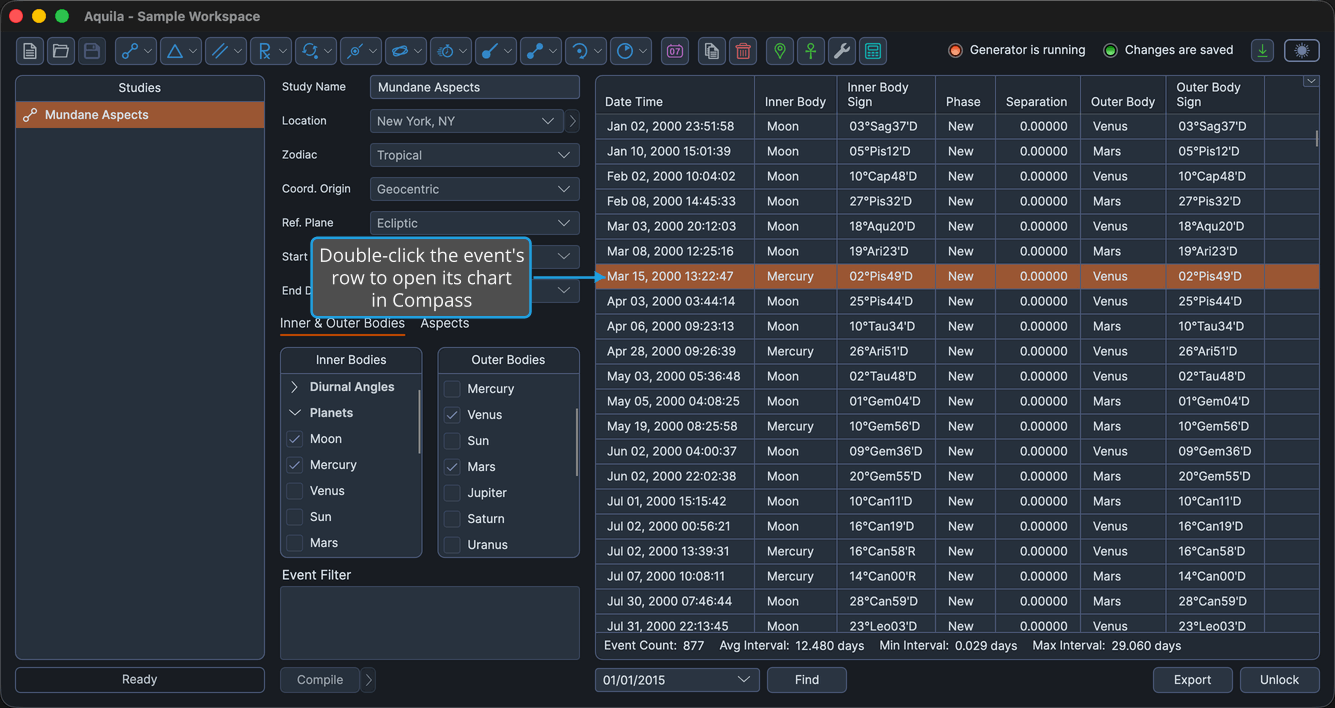
Double-clicking an event row hands the event's moment and the study's settings to Compass, the companion chart application, which draws the chart for that instant. Aquila draws no charts itself.
Open the Chart
To see the chart for an event in the events table:
- Double-click the event's row.
What Travels with the Request
The chart opens configured to match the study it came from, because Aquila sends the study's settings along with the moment:
- Location
- Reference System (Zodiac, Coordinate Origin, Reference Plane)
- Bodies
- Natal bodies
- Aspect angles
What Happens on Each Side
What the gesture does depends on whether Compass is available:
| State of Compass | What Happens |
|---|---|
| Running | Compass takes the request directly and opens the chart in the window already on screen. |
| Installed but closed | Aquila launches Compass with the request, and Compass draws the chart once it has started. |
| Not installed | Nothing happens. |
From the Timeline Table
The same gesture works on the Timeline table. There, Aquila takes the settings from the source study the row came from, so a timeline gathering events from several studies opens each chart with the settings of the study that generated that event. See Timeline Table.