Timeline Table
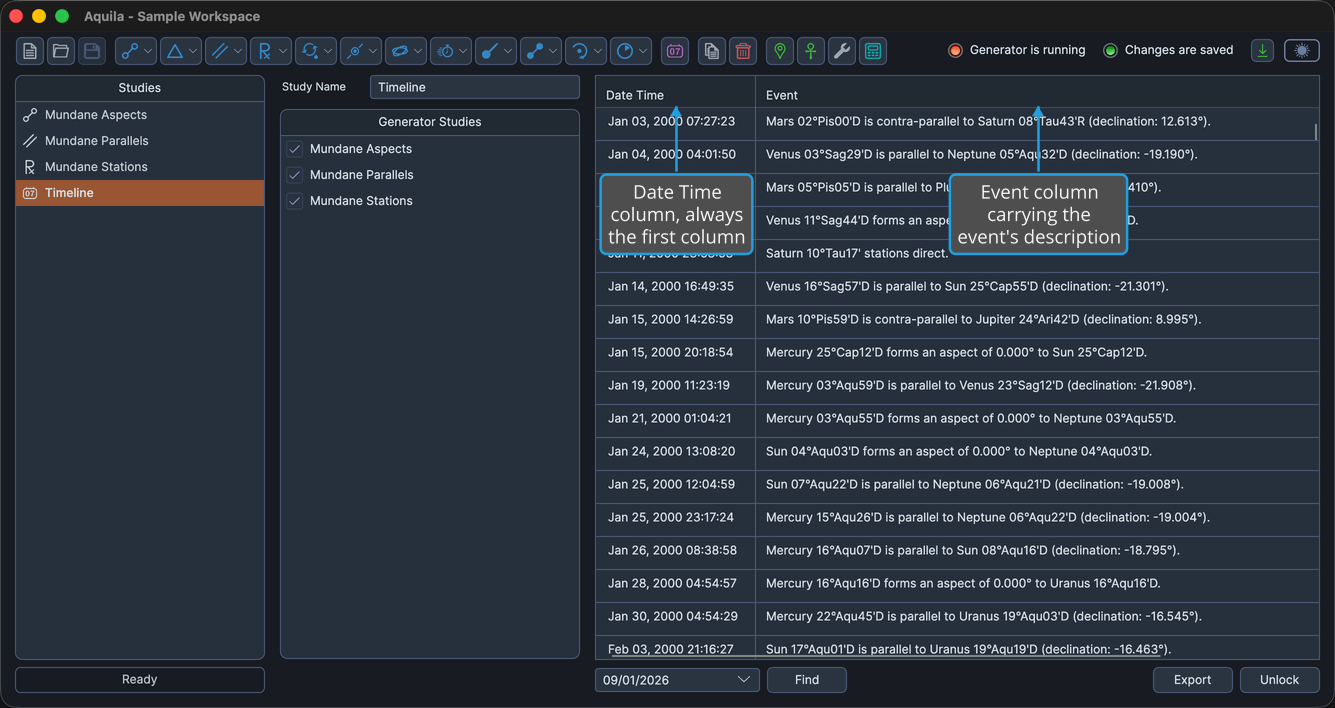
Reading a merged chronology is the whole purpose of a timeline, and the Timeline table is where that chronology appears. It fills the right-hand side of the Timeline view and lists every event drawn from the selected source studies in chronological order.
The table is deliberately spare. Two columns keep the emphasis on when something happened and what it was, without the disruption of switching back and forth between the individual studies the events came from.
Timeline Table Columns
The table has exactly two columns, and the set never changes.
| Column | Description |
|---|---|
| Date Time | The moment the event occurred, shown in the time zone of the source study's location. Always the first column. |
| Event | The event's description, wrapped across as many lines as it needs so nothing is cut off. |
Neither column can be sorted by clicking its column header. The table is already in date order, which is the order a merged chronology is meant to be read in.
Select Events
To pick a single moment out of the merged chronology:
- Click the event's row in the Timeline table.
Aquila highlights the clicked row, which becomes the Timeline study's selected event.
To highlight a contiguous block of events so you can act on several rows at once:
- Click the first event's row in the Timeline table.
- Hold Shift and click the last event's row in the Timeline table.
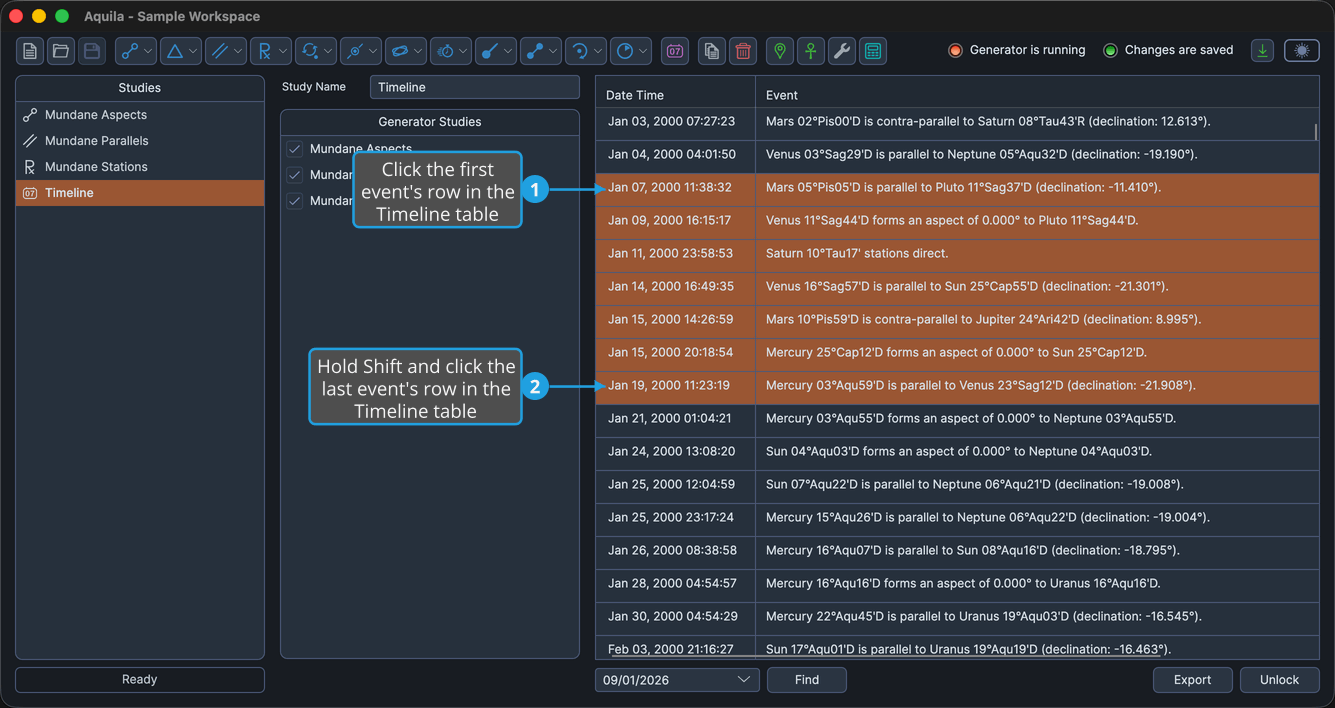
Aquila highlights every row between the first and last click, and the commands that act on a multi-row selection become available. See Copy Timeline Events for what can be done with a selection.
Open a Chart from a Row
Double-clicking a row hands that moment to Compass, resolving the settings from whichever source study the row came from. See Open Chart from an Event.