Timeline Table
The Timeline table displays the events that the Timeline Study has aggregated from its selected generator studies. The table presents an elegantly simplified two-column view containing only dates and event descriptions, so you can see the confluence of key events without switching between individual studies.
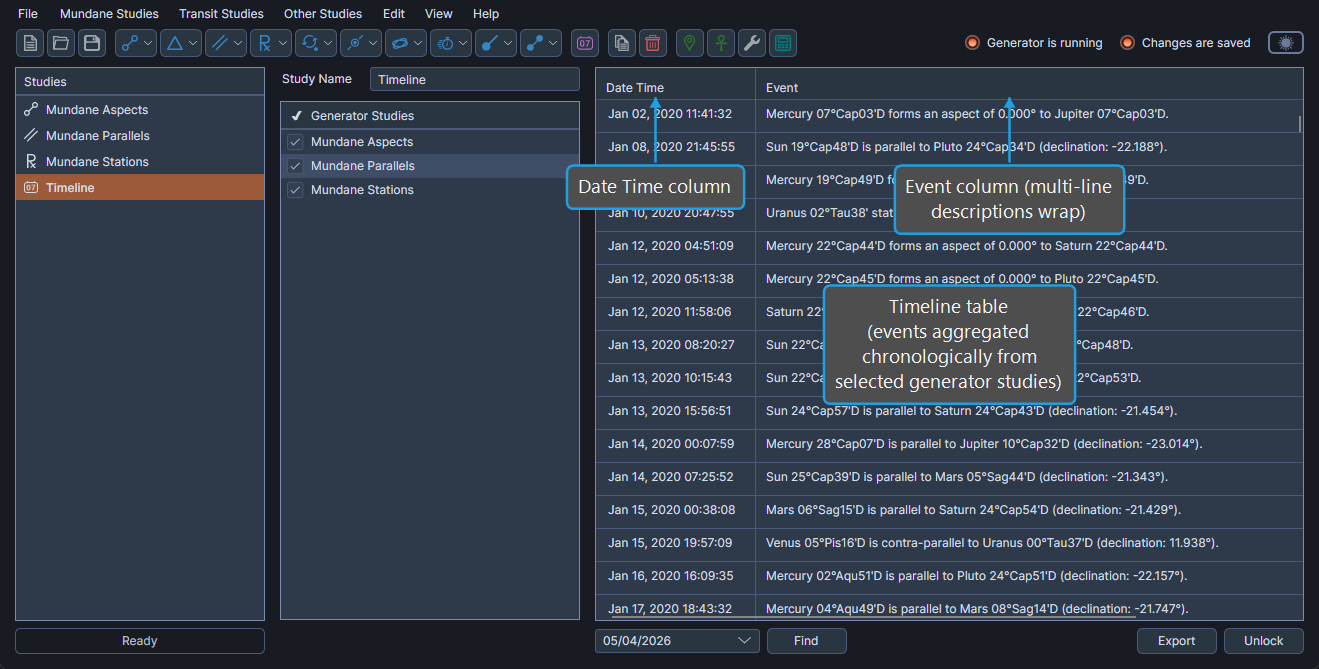
The Timeline table is read-only and does not support column reordering or column visibility toggling.
Timeline Table Columns
The Timeline table contains the following columns:
| Column | Description |
|---|---|
| Date Time | Date and time of the aggregated event in long date/time format. |
| Event | A human-readable description of the event. Multi-line descriptions wrap within the column. |
Select a Timeline Event
To select an event row:
- Click the event row in the Timeline table.
The clicked row is highlighted. Use the right-click context menu to copy the selection in any of several formats.
Open the Row Context Menu
To open the row context menu:
- Right-click on an event row in the Timeline table.
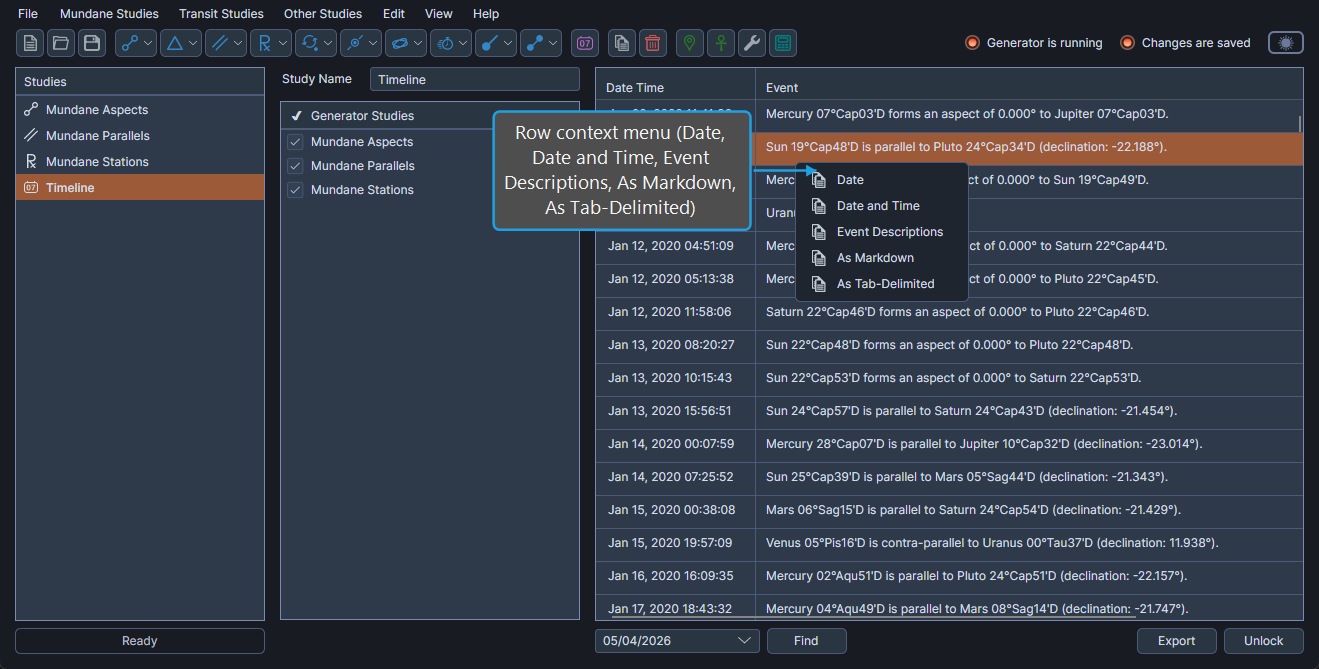
The context menu provides the following copy options:
| Option | Description |
|---|---|
| Date | Copy the event's date (without time) to the clipboard. |
| Date and Time | Copy the event's full timestamp to the clipboard. |
| Event Descriptions | Copy the textual descriptions of the selected events to the clipboard, one per line. |
| As Markdown | Copy the selection as a formatted Markdown table. |
| As Tab-Delimited | Copy the selection as tab-delimited text. |