Ephemeris Table
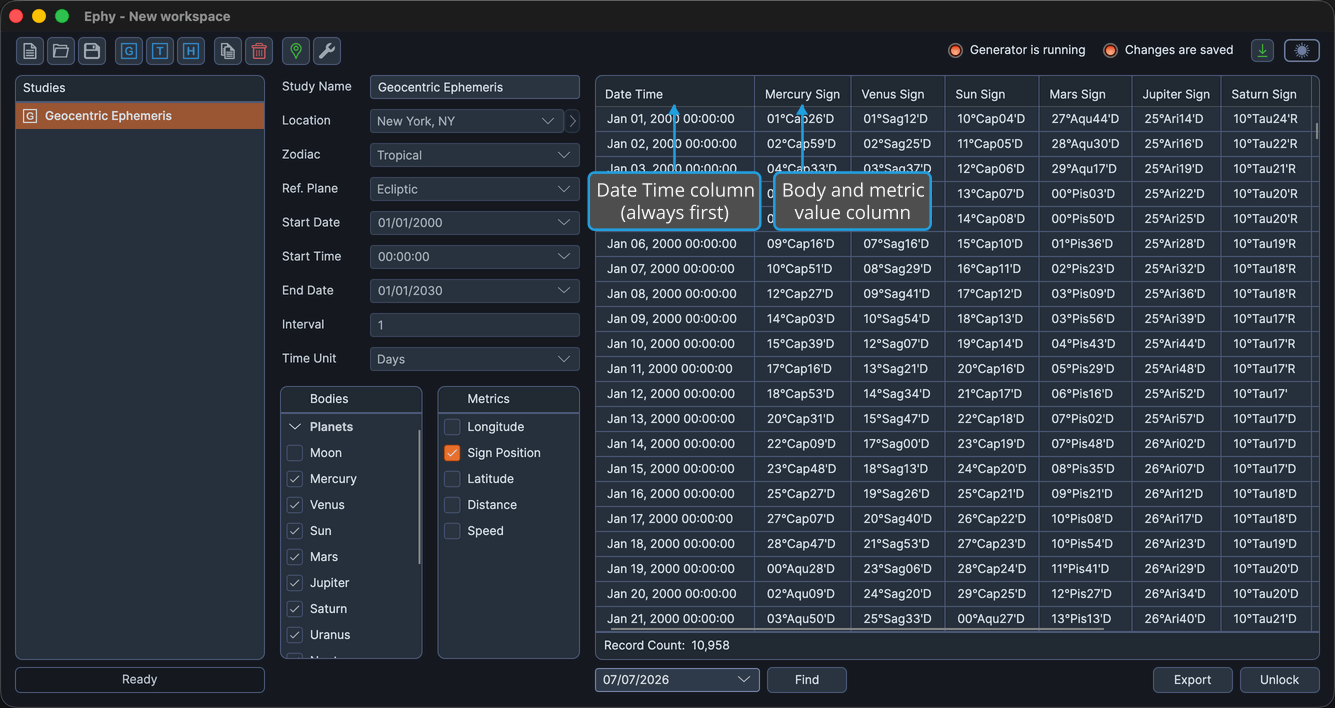
The ephemeris table displays a study's generated records, with one row for each sampled date and time. Its first column is always the record's date and time, followed by one column for each body and metric you selected. The table appears the same way in all three ephemeris study types.
Column Structure
The table's columns are built from a fixed leading column plus a set of columns generated from your selections. The table below shows the column structure, not a full list of columns: the actual columns you see depend on which bodies and metrics the study includes.
| Column | Block | Description |
|---|---|---|
| Date Time | Fixed (always first) | The sampled date and time of the record, formatted for your locale. This column is pinned to the first position and cannot be moved. |
{Body / Metric} | Repeating (one per selected body and metric) | The value of a selected position metric for a selected body. Distance values are expressed in AU, and speed values in degrees per day. |
Reading and Adjusting the Table
Scroll the table to review the records. You can adjust how the table looks in several ways:
- Resize a column: Drag the divider between two column headers left or right.
- Reorder columns: See Reorder Record Columns.
- Show or hide columns: See Toggle Column Visibility, or select metrics in the Metrics Selection List.
note
The columns in the ephemeris table cannot be sorted.