Station Hotspots Study
A station on a sensitive degree holds a body there for weeks, and the Station Hotspots study isolates those coincidences from ordinary stations. It generates an event each time a transiting body stations retrograde or direct while within orb of a critical degree.
Each event records the body, the kind of station, the position at which it turned, and the hotspot degree it turned on.
Create a Station Hotspots Study
To add a Station Hotspots study to the current workspace:
- Click Mundane Studies → Stations on the menu bar.
- Click Station Hotspots in the Stations submenu.
Alternatively, click the Station Studies drop-down button on the toolbar and select Station Hotspots from its flyout.
The new study appears at the bottom of the Studies list and is selected automatically, so its settings open immediately. It takes its name from the study type.
What This Study Finds
An event is generated when a body stations, retrograde or direct, at a moment when it is also conjunct one of the critical degrees entered in the Hotspot Degrees table. The Transit Orb governs how close the body has to be to a hotspot for the coincidence to count, and it is one of the shared Orb Settings that several studies carry. Set the Event Type drop-down to restrict the study to one kind of station only.
The settings column holds the Study Name, the ephemeris settings, the study date range, the Event Type drop-down and the Transit Orb field, followed by a Bodies selection list and the Hotspot Degrees table of critical degrees watched.
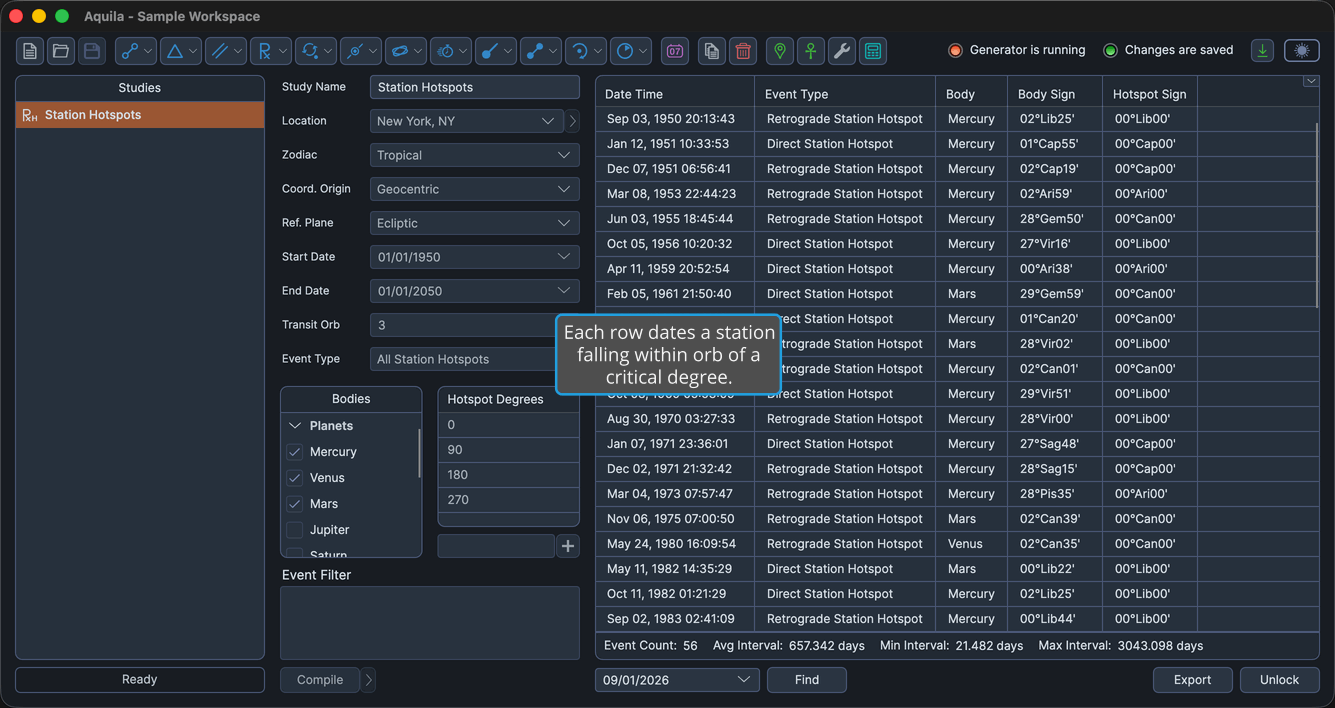
Events Table Columns
The events table lists one row per coincidence. Several columns are hidden by default, as the table notes. Right-click any column header to show or hide a column, as described in Choose Events Table Columns. The coordinate columns follow the study's Reference Plane: their headers read Longitude and Latitude in the ecliptic plane, and Right Asc and Declination in the equatorial plane. The table below gives the ecliptic-plane headers.
| Column | Description |
|---|---|
| Date Time | Date and time the station perfects, in the application's long date and time format. Always the first column, and it cannot be moved. Visible by default. |
| Event Type | Whether the body stationed retrograde or direct. Visible by default. |
| Body | Name of the celestial body. Visible by default. |
| Body Longitude | The body's primary coordinate, in degrees. Hidden by default. |
| Body Sign | The body's position as degrees, sign and minutes of the zodiac. Visible by default. |
| Body Latitude | The body's secondary coordinate, in degrees. Hidden by default. |
| Body Distance | The body's radial distance, in astronomical units (AU). Hidden by default. |
| Body Speed | The body's speed, in degrees per day. Hidden by default. |
| Hotspot Longitude | The critical degree that was contacted, as a primary coordinate in degrees. Hidden by default. |
| Hotspot Sign | The critical degree expressed as degrees, sign and minutes of the zodiac. Visible by default. |
| Separation | Angular separation between the body and the hotspot, in degrees. Hidden by default. |
| Event Interval | Elapsed time since the previous event in the list. Hidden by default. |