Chart Settings Window
The Chart Settings editor is the one place to set the defaults new charts open with and the colors every chart is drawn in. Compass has a single Chart Settings editor for the whole application: opening it while it is already open brings it to the front instead of opening a second one.
Make your changes on its tabs and click Save to keep them, or click Close and choose in the Unsaved Changes prompt whether to save them.
Window Layout
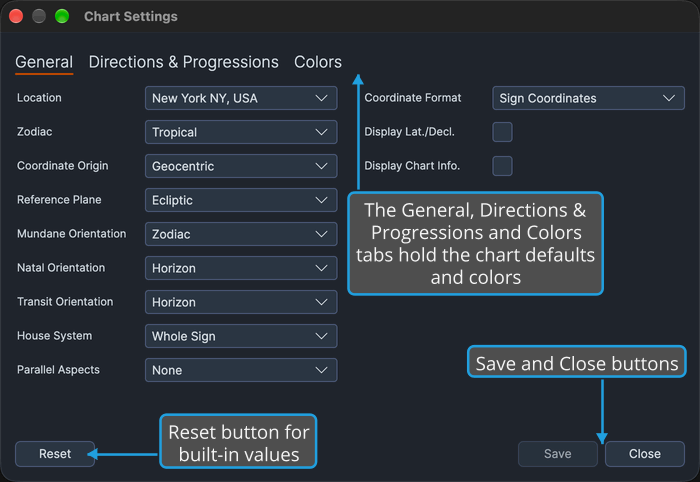
The window has three tabs across the top and a bar of buttons along the bottom.
| Tab | What You Set There |
|---|---|
| General | The location, calculation frame, orientations, house system, parallel aspects and display options that new charts open with. See General Chart Defaults. |
| Directions & Progressions | The defaults for the three technique charts, on one sub-tab per chart type. |
| Colors | The color each zodiac sign and chart body is drawn in on the wheel. See Chart Colors. |
The Directions & Progressions tab holds three sub-tabs:
- Primary Directions: the defaults a new Primary Directions chart opens with. See Primary Directions Defaults.
- Solar Arc Directions: the defaults a new Solar Arc Directions chart opens with. See Solar Arc Directions Defaults.
- Secondary Progressions: the defaults a new Secondary Progressions chart opens with. See Secondary Progressions Defaults.
The bar along the bottom holds three buttons:
- Reset, at the bottom left, puts every color and every default back to the values Compass ships with. See Reset Chart Settings.
- Save, at the bottom right, keeps your changes for future sessions. It is grayed while the window holds no unsaved edits. See Save Chart Settings.
- Close, also at the bottom right, closes the window, as described under Close the Chart Settings Window below.
When Changes Take Effect
Colors and defaults reach your charts differently:
- A color change redraws every open chart in the new color at once.
- A change to a default seeds the next chart window of that type. Charts that are already open keep their own settings.
Nothing is written to disk until you save. If you close the window without saving, the last saved settings come back, and open charts return to their last saved colors.
Open the Chart Settings Window
Open the window from the menu bar once Compass has finished loading its settings and reference data. On macOS, the Edit menu is in the menu bar at the top of the screen.
- Open the Edit menu, as described in Open the Edit Menu.
- Click Chart Settings.
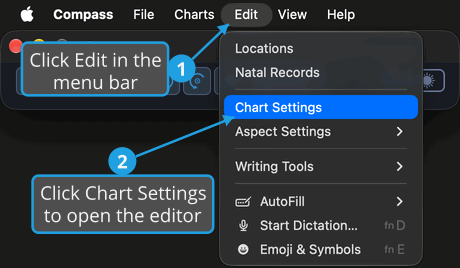
The Chart Settings editor opens with its General, Directions & Progressions and Colors tabs. If it is already open, it comes to the front instead.
The Chart Settings button on the Main Toolbar, and the Chart Settings button on any chart window's toolbar (see Chart Window Toolbar), open the same window.
Close the Chart Settings Window
Close sits at the bottom right of the window, and the window's title-bar close button does the same. What happens next depends on whether the window holds unsaved edits, which it does whenever Save is not grayed. With unsaved edits, closing brings up the Unsaved Changes prompt, which asks "Would you like to save your changes before closing?"
Close a Window with No Unsaved Edits
While Save is grayed, the window has nothing to save and closes at once:
- Click Close.
Save Changes as You Close
To keep your unsaved edits as the window closes:
- Click Close.
- Save the changes from the Unsaved Changes prompt, as described in Save Changes from the Unsaved Changes Prompt.
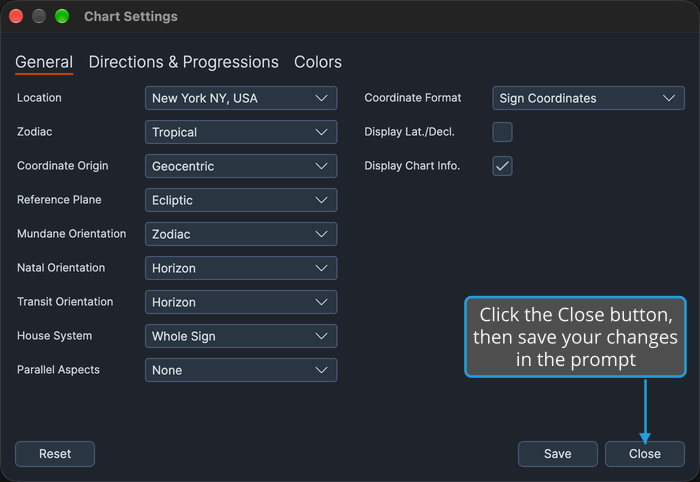
Your colors and defaults are written to disk and the window closes. If the save fails, Compass reports the failure and the window stays open with your edits.
Discard Changes as You Close
To close the window without keeping your unsaved edits:
- Click Close.
- Discard the changes from the Unsaved Changes prompt, as described in Discard Changes from the Unsaved Changes Prompt.
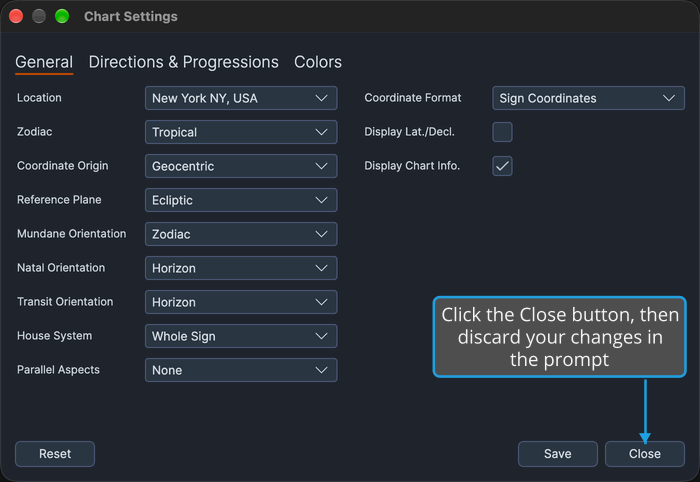
The colors and defaults return to their last saved values, open charts return to the saved colors at once, and the window closes.
Cancel the Close
To back out of closing once the prompt appears:
- Click Close.
- Cancel the close from the Unsaved Changes prompt, as described in Cancel Closing from the Unsaved Changes Prompt.
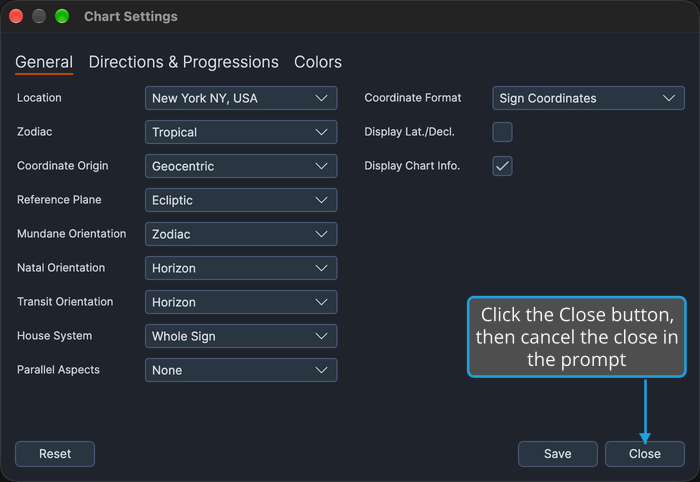
The window stays open with your unsaved edits in place.