Heliocentric Graphic Ephemeris Study
A heliocentric graphic ephemeris study plots positions measured from the center of the Sun as time-series curves. Each body's curve reflects its own orbit rather than the Earth's viewpoint, which gives a much simpler picture of planetary motion than the geocentric equivalent: no retrograde loops, only steady progressions at each body's own rate.
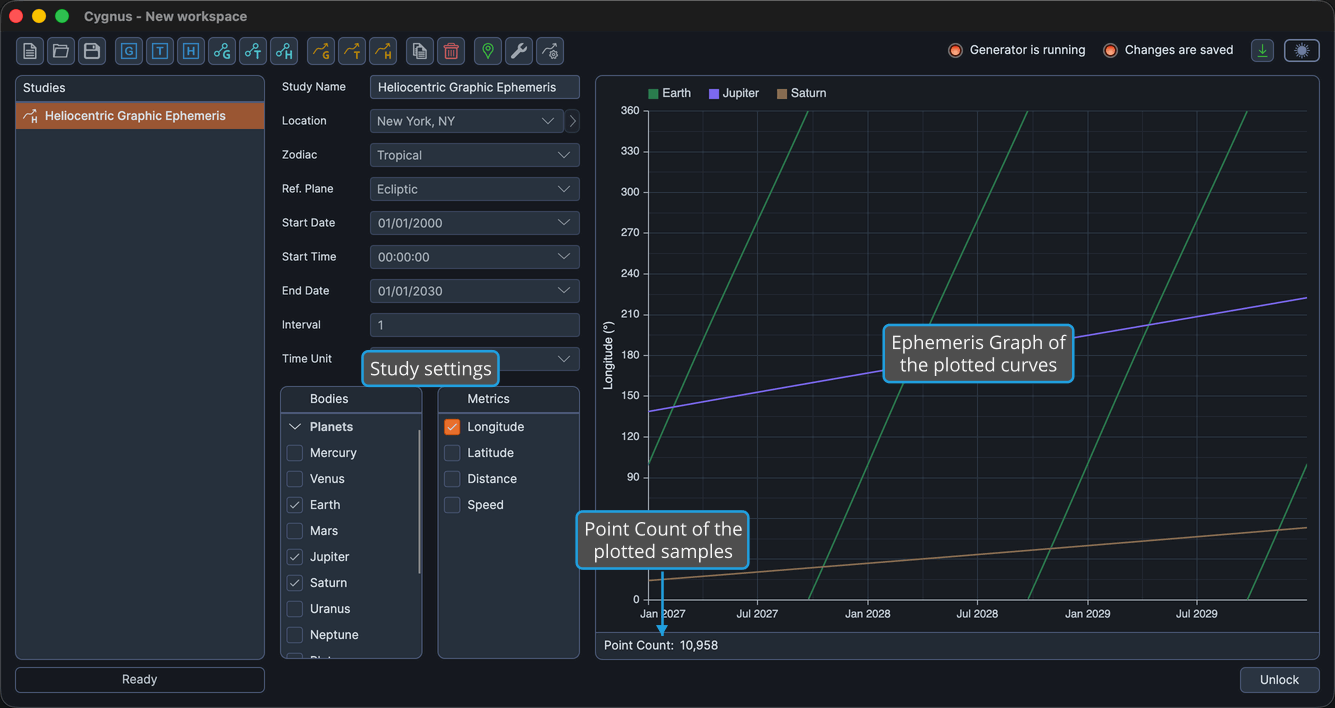
The study settings occupy a column on the left exactly as they do on a tabular ephemeris. The right side is an Ephemeris Graph instead of an ephemeris table.
Create and Generate the Study
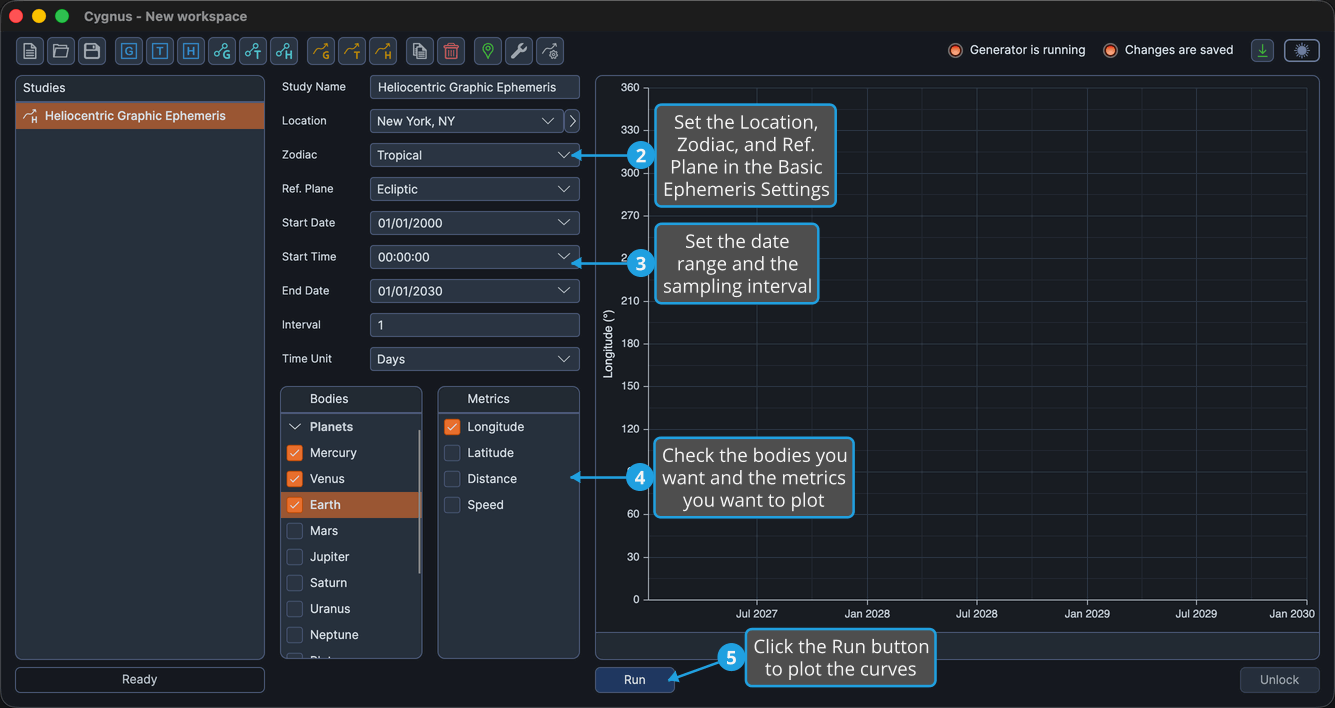
To produce a heliocentric graphic ephemeris:
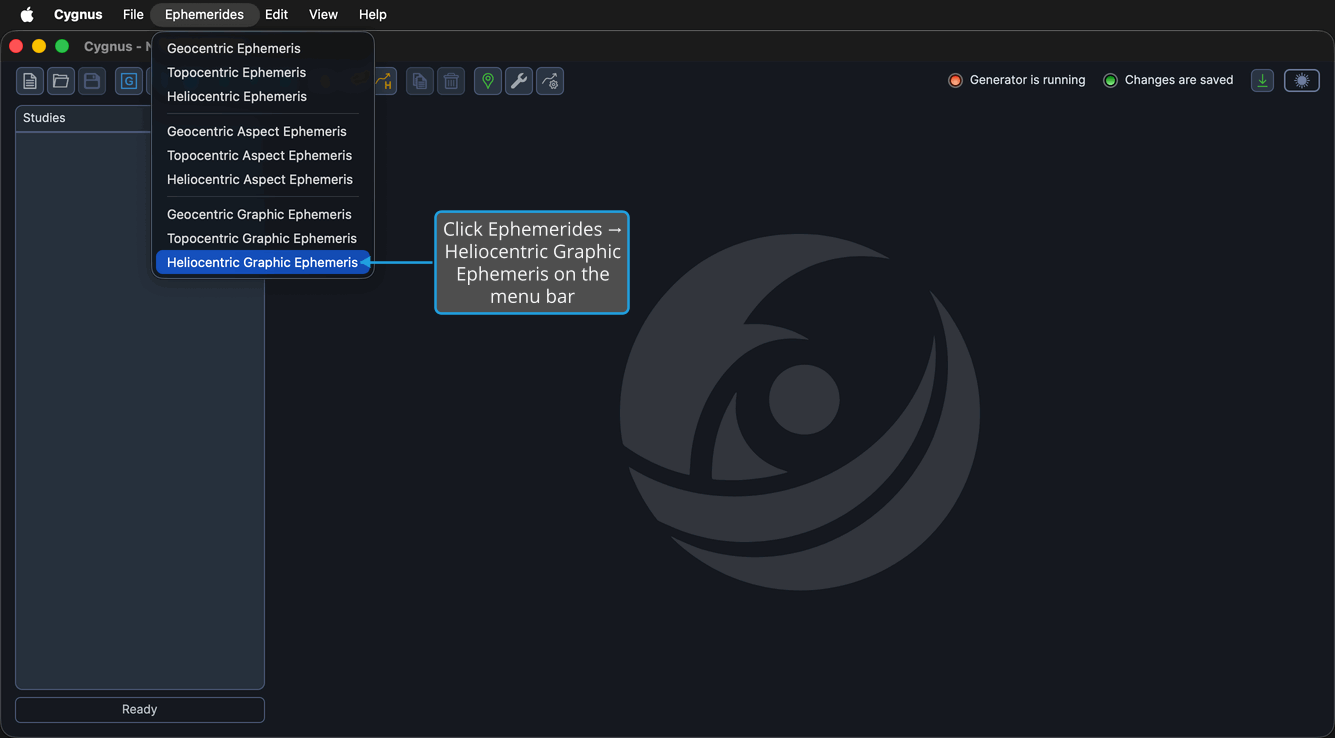
- Click Ephemerides → Heliocentric Graphic Ephemeris on the menu bar.
- Configure the Basic Ephemeris Settings (Location, Zodiac, Ref. Plane).
- Configure the Ephemeris Date Range (Start Date, Start Time, End Date, Interval, Time Unit).
- Check the bodies you want in the Bodies list and the metrics you want to plot in the Metrics list.
- Click the Run button beneath the graph.
Step 1 is performed on the Ephemerides menu:
An Interval of 1 with a Time Unit of Days gives one plotted sample per day.
A location is required even though heliocentric positions do not depend on one. Cygnus calculates and displays each sample's date and time in the location's time zone. See Basic Ephemeris Settings.
Bodies
A heliocentric graphic study offers 24 bodies under five classification groups: Planets, Barycenters, Asteroids, Centaurs, and Uranians. Bodies with no heliocentric meaning are absent, so there is no Diurnal Angles group and no Lunar Axis group, and the Sun and the Moon do not appear. Earth takes their place as an orbiting body. See Bodies List.
Each body's curve is drawn in the color assigned to it in Graph Settings.
Plotted Metrics
Only the four plottable metrics are offered. Sign Position has no graphic counterpart and is not in the list.
| Ecliptic reference plane | Equatorial reference plane | What it plots |
|---|---|---|
| Longitude | Right Asc | The body's position along the reference plane, in degrees. |
| Latitude | Declination | The body's position perpendicular to the reference plane, in degrees. |
| Distance | Distance | The body's distance, in AU. |
| Speed | Speed | The body's rate of motion, in degrees per day. |
Longitude is checked by default on a new graphic study. Each plotted metric gets its own value axis at the side of the plot.
After the Curves Are Plotted
The study locks when the generation completes, and the Run button becomes invisible until you unlock the study. The plot itself stays fully interactive:
- Show or hide a plotted metric. The plot redraws without generating the study again, because the generated series already carry all four metrics.
- Read a value off a curve.
- Adjust a value axis range.
- Pan and zoom the time window.
Changing which bodies are plotted does require unlocking and generating again.
A graphic study has no ephemeris table, so the Find and Export controls are hidden on it, and the count beneath the plot is labeled Point Count: rather than Record Count:. See Record Count.