Chart Display Options
Write the wheel's positions in the notation you read most easily, and show or hide extra detail as the chart in front of you needs. The display strip beneath the wheel of every chart window holds three display settings: select a Coord. Format, and check or uncheck Display Lat./Decl. and Display Chart Info.
Set the Chart Display Options
These three settings govern how this chart window writes positions and what extra detail its wheel shows. Each control already shows its current value, and none depends on another, so change only the ones you want, in any order:
- Select a format from the Coord. Format drop-down beneath the wheel to write positions as Sign Coordinates or Cycle Angles.
- Check or uncheck the Display Lat./Decl. check box to show or hide each body's latitude on an ecliptic wheel, or its declination on an equatorial wheel.
- Check or uncheck the Display Chart Info. check box to show or hide the chart information block in the center of the wheel.
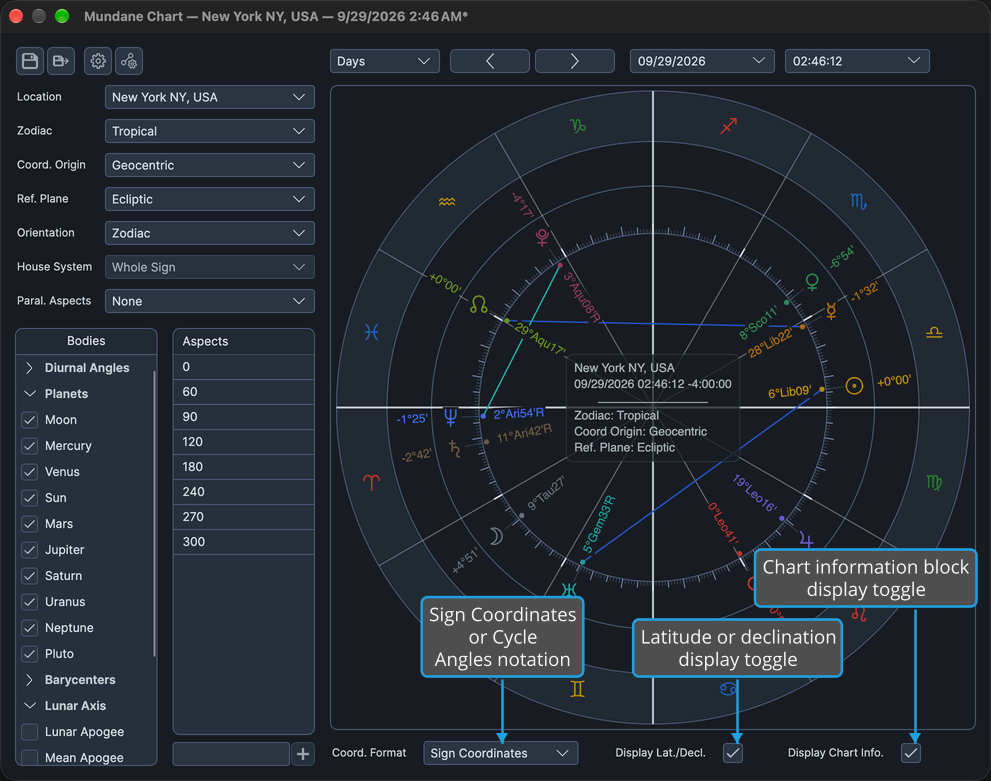
The wheel redraws at once. The change affects only this chart window.
Coordinate Formats
The Coord. Format drop-down offers two formats, and its list never changes:
| Format | Description |
|---|---|
| Sign Coordinates | Degrees and minutes within a 30° sign, such as 15°Leo37'. |
| Cycle Angles | Decimal degrees around the full circle, from 0° up to 360°, such as 135.616°. |
While the chart's reference plane is Equatorial, the Coord. Format drop-down is disabled and the wheel writes positions as Cycle Angles. The format you chose is kept, and it returns when the reference plane goes back to Ecliptic. The reference plane is set in the chart's settings panel, as described in Chart Frame.
Where the Display Options Come From
A new chart window opens with the display options set on the General tab of the Chart Settings editor, described in General Chart Defaults. A chart reopened from a chart file opens with the values it was saved with.
Changing an option on the display strip affects only the window it is in. Other open chart windows, and the defaults new chart windows open with, stay as they were.
Related Topics
- Chart Wheel: what the wheel draws, including each body's latitude on an ecliptic wheel or its declination on an equatorial wheel, and the chart information block.
- Chart Frame: the reference plane that decides whether the coordinate format can be chosen.
- General Chart Defaults: the display options a new chart window opens with.
- Open Chart File: reopen a saved chart with the display options it was saved with.