Graphic Ephemeris Study
See how bodies' positions, latitudes, distances and speeds evolve over time as curves rather than rows of numbers. Create a Graphic Ephemeris study, configure its settings and date range, check the bodies and the metrics to plot, then click Run and explore the graph.
A Graphic Ephemeris study samples the positions of the selected bodies at a fixed interval across a date range, from the study's coordinate origin. Instead of listing the samples in an ephemeris table, it plots them as an interactive time-series graph: the Ephemeris Graph.
A Graphic Ephemeris study has no ephemeris table, so it has no Find or Export controls and no Column Visibility Menu. The count beneath the graph reads Point Count: rather than Record Count:.
Study Layout
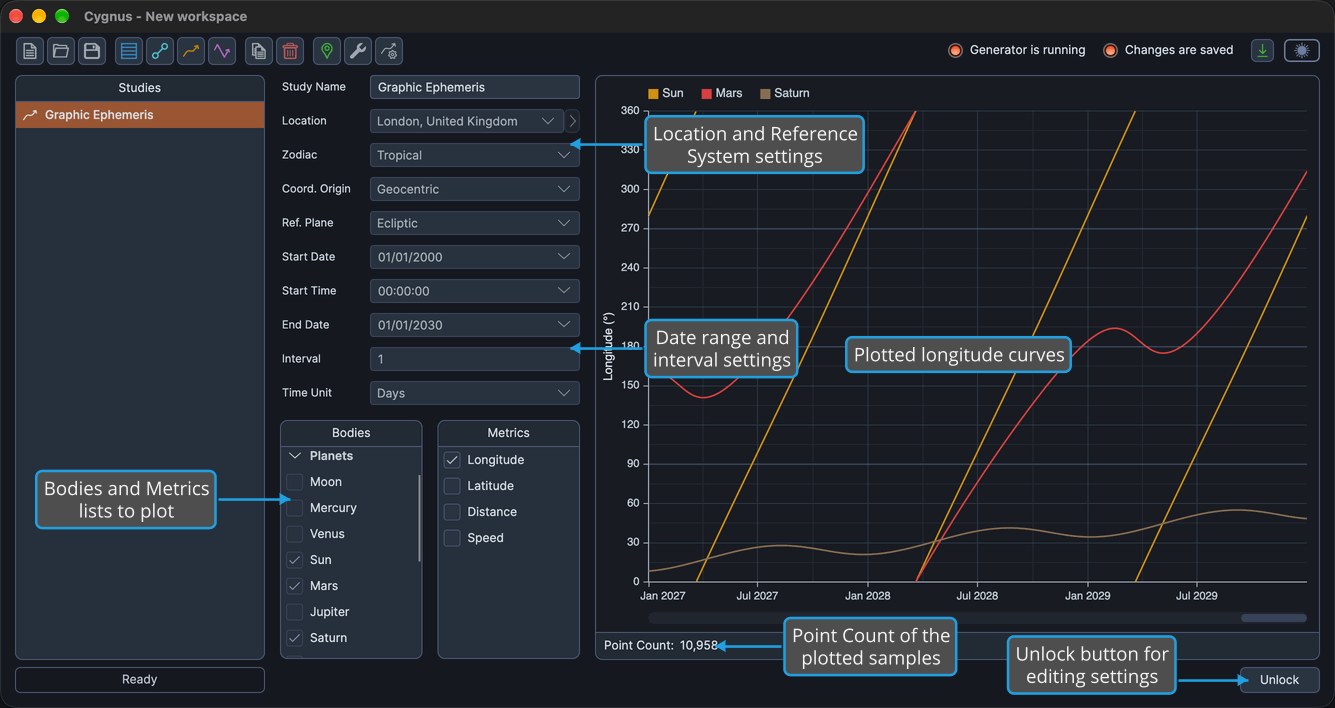
When you click a Graphic Ephemeris study in the Studies List, its view fills the study area. The settings column on the left holds, from top to bottom:
- Study Name: the name the study has in the Studies list. See Study Name.
- The Location, Zodiac, Coord. Origin and Ref. Plane settings. See Location and Reference System.
- The Start Date, Start Time, End Date, Interval and Time Unit settings. See Date Range and Interval.
- The Bodies and Metrics lists, side by side. See Bodies List and Body Metrics List.
The results area on the right holds the graph, the point count beneath it (see Record and Point Count), and a button bar with three buttons:
| Button | Description |
|---|---|
| Run | Generates the curves plotted on the graph. See Generate Study. |
| Cancel | Stops a generation in progress. See Cancel Study Generation. |
| Unlock | Deletes the plotted curves and makes the study's settings editable again. See Unlock Study. |
Metrics You Can Plot
The Metrics list of a Graphic Ephemeris study offers only the four plottable metrics: Longitude (or Right Asc), Latitude (or Declination), Distance in AU and Speed in degrees per day. Sign Position is not among them. A new study plots Longitude only.
Under the Equatorial reference plane, Longitude and Latitude read Right Asc and Declination. Each body is drawn in its color from Graph Settings, and the line pattern shows which metric a curve plots: see Ephemeris Graph.
Generate a Graphic Ephemeris Study
Create the study with Ephemerides → Graphic Ephemeris on the menu bar, or with the Graphic Ephemeris button on the toolbar: see Create Study. The Graphic Ephemeris button is the third of the four study-type buttons and shows an icon only: the same icon as a Graphic Ephemeris study in the Studies list and, on Windows, as Graphic Ephemeris in the Ephemerides menu. The new study, named "Graphic Ephemeris", appears selected at the bottom of the Studies list, and its settings already hold the workspace defaults.
Change the location, Reference System, date range or interval only where this study needs other values: see Location and Reference System and Date Range and Interval. Every study needs a location, whatever its coordinate origin, because its dates and times are given in the location's time zone. Most ephemerides use an interval of 1 day.
The Bodies list of a new Graphic Ephemeris study already has the bodies of the default preset checked: the Mercury -> Pluto preset, unless you have marked another preset as the default (see Bodies List Presets).
To choose the bodies and metrics and generate the graph:
- Check the bodies to plot in the Bodies list, and uncheck any you want to leave out.
- Check the metrics to plot in the Metrics list.
- Click Run in the button bar below the graph.
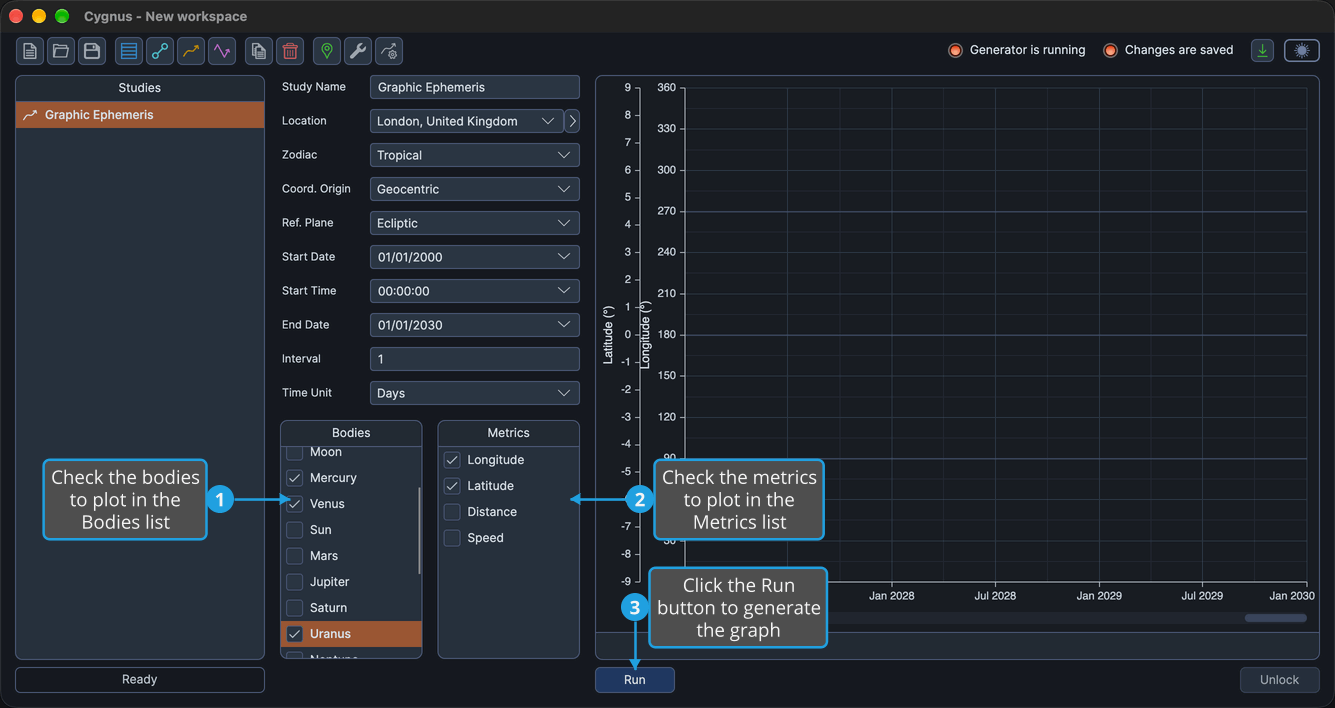
The study locks while it generates, and a progress bar beside the Cancel button shows the percentage complete. When generation finishes, the graph shows the curves, opening on the most recent part of the generated span. The point count appears beneath the graph, and the Run button disappears until you unlock the study.
Change What Is Plotted
- Metrics: check or uncheck a metric in the Metrics list at any time. The graph redraws at once, without generating the study again, because the generated study already holds all four metrics.
- Bodies: to change which bodies are plotted, unlock the study, change the Bodies list and generate the study again. Unlocking deletes the plotted curves, but keeps any value axis ranges you adjusted: see Unlock Study.
Explore the Graph
- Rest the pointer on a curve to see a crosshair and a readout of the sample's date and value. The readout names the body but not the metric: the line's color and pattern identify it. See Graph Hover Readout.
- Drag on a value axis to adjust the range of the metric it scales. Adjusted ranges are saved with the study and survive an unlock. See Adjust a Graph Value Axis Range.
- Drag inside the plot to pan the time window, and drag the time-axis strip at the foot of the plot to zoom it. The time window is not saved: it is recomputed each time the study is opened. See Pan and Zoom the Graph Time Window.
- Double-click a point on a curve to open its chart in the companion application Compass. See Open a Graph Point's Chart in Compass.
Related Topics
- Ephemeris Graph: read the curves, axes and legend of the graph.
- Create Study: add a new study of any type to the workspace.
- Generate Study: produce the graph of a configured study and follow its progress.
- Ephemeris Study: list the same positions as records in an ephemeris table.
- Graphic Aspect Ephemeris Study: plot the cycle angle and separation of body pairs.
- Graph Settings: choose the colors of the bodies' curves.